Household savings measures - can we trust the numbers?
The Office of the Retirement Commissioner explains how household savings are currently measured, and, more importantly, the inherent pitfalls with the measures that limit their usefulness.
Tuesday, March 13th 2001, 10:22PM
Listening to commentators, it is easy to assume that New Zealanders are not good savers. Last week an article on the front page of the Herald criticised New Zealander's savings level, and a headline in The Dominion (29 January 2001) read "Kiwis score worst on savings table". And often saving statistics are used to illustrate a point. For example, because of low national savings, we need to borrow from overseas to finance our investments, thereby increasing our current account deficit.
But how robust are the measures of household savings in New Zealand on which such assertions are based?
Caution needs to be exercised when referring to saving statistics, because the saving data currently available in New Zealand has limitations due to the difficulties of defining and measuring saving.
Measuring saving
Generally, saving is measured either by the "flow" approach or the "stock" approach. In the "flow" approach, saving is calculated as the difference between income and expenditure. The "stock" approach on the other hand, estimates saving as the difference between assets and liabilities.
In New Zealand, the only official statistics available on household savings are the ones reported by Statistics New Zealand in the Household Income and Outlay Account in the System of National Accounts. These accounts use the "flows" approach to measure savings. The main limitation of these statistics is that they have a wide margin of error, as saving is the residual between two large numbers (income and expenditure).
Using the "flows" approach, saving rates may in fact be understated, because:
- income may not be declared if it is derived from underground activity;
- investment in education and health care is treated as consumption; and
- the exclusion of capital gains may understate income.
The "stock" measures currently available in New Zealand are the Household Savings Indicator compiled by NZIER and Morningstar on behalf of WestpacTrust; and the household balance sheet data collected by the Reserve Bank.
The main limitations of the "stock" measures are that they rely on surveys and estimates, and do not include all types of assets and liabilities.
There are some other sources from which information on household savings can be extracted. For example, the Household Economic Survey is a sample survey undertaken by Statistics New Zealand and is aimed at collecting household income and expenditure details. Another source of information is the Managed Fund survey by the Reserve Bank.
The difficulties of defining and measuring savings result in stark differences across the various measures; and even though there are several measures of household saving available in New Zealand, the inherent measurement difficulties limit their usefulness.
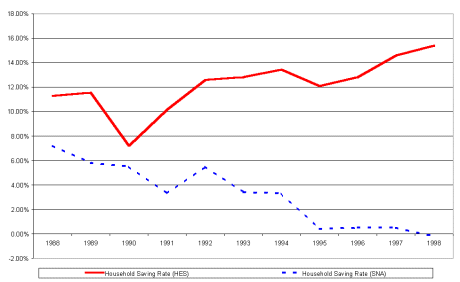
The following graph illustrates the stark contrast between saving rates as measured by the Household Economic Survey and the System of National Accounts. The Household Economic Survey (HES) is designed to collect household income and expenditure details. Given these details, the ‘flow’ measure can be applied to calculate savings. However, this should be done with caution, as the HES is not designed to produce reliable household saving figures per se. There are a number of reasons that limit the use of the HES to derive total household saving figures, including:
- incomplete population coverage;
- under-representation of certain household groups (including the wealthy);
- sample errors;
- inaccurate or estimated responses;
- non-matching of the reporting periods for the income and expenditure components;
- different reporting units for the components.

*Household saving rate = household saving as a percentage of household disposable income
Source: Statistics New Zealand, National Accounts and Household Economic Survey.
International comparisons are also difficult
Measurement problems make international comparisons difficult too. As well as the limitations of the savings data, direct comparisons with other countries are further complicated by the fact that New Zealand is relatively unique because of its universal public pension (as opposed to an earnings-related state pension) and the absence of a compulsory retirement savings regime.
Demographics, economic trends and institutional factors can also result in variations in saving rates across countries.
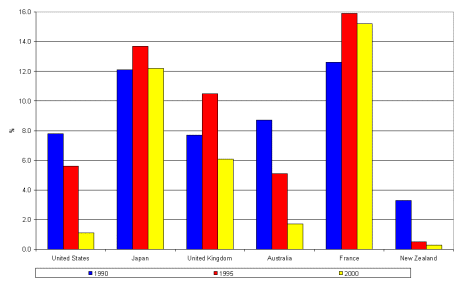
Nevertheless, based on current measures, by international standards New Zealand’s household saving rate is low.
Household Saving Rates in selected OECD countries
New survey will help complete the picture
You can download a full copy of the paper called Measuring Household Savings in New Zealand, from which this article was drawn, from the Office’s web site at
www.retirement.org.nz/research/research.html| « Column: A ripping yarn about Government investment funds | King builds an empire » |
Special Offers
Commenting is closed
| Printable version | Email to a friend |


