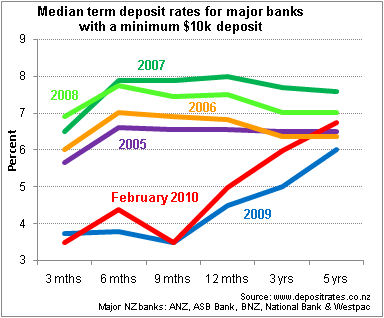

The above graph shows the yield curve with little variation within the four year period of 2005 through to 2008 in comparison to the positive curve as it now stands due to the depth that the short-term rates have plummeted.
| « Fin Coy offers new, higher rates | 12-months of PIE's » |
Special Offers

© Copyright 1997-2026 Tarawera Publishing Ltd. All Rights Reserved