
by Harbour Asset Management
As expected by the market, the US Federal Reserve lifted the US Fed Funds Rate this week to 1.75%-2.00%. This was the second hike in 2018, and a continuation in a cycle that began in late 2015.
In a post-GFC environment where interest rates are eventually expected to settle at lower levels, it’s natural to ask how far away the US Federal Reserve is to the end of its interest rate cycle.
At the same time, in New Zealand, the Official Cash Rate has been on hold at record lows since the end of 2016, and the focus is on the different issue of when a hiking cycle will eventually begin.
To address the question for US interest rates, we can compare the US Fed Funds Rates with assumptions for some long run neutral level and market pricing. A simple rule of thumb is that neutral interest rates should be around the sustainable growth rate in nominal GDP (real GDP growth + inflation).
Over the past five years, we can also use the FOMC’s own long-run assumptions from the so-called Dot Plots.
The chart below maps the US Fed Funds Rates against this estimate of neutral Fed Funds and an estimate of market pricing (proxied by the implied market one-year rate five years ahead).
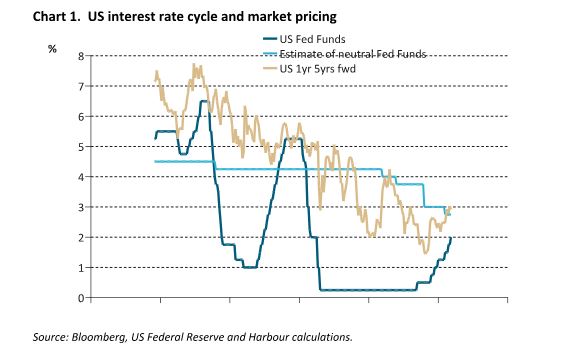
What it illustrates is that, for a long period since 2012, the market has tended to price-in the US Fed Funds Rate finally settling well below the FOMC’s own long-run assumption.
However, over the past year these have converged so that both the FOMC and market are picking that US Fed Funds Rate settles at around 2.75-3.00%.
In practice, this means the Fed hiking another couple of times in each of 2018 and 2019, and then staying on hold for a prolonged period, perhaps as the momentum of the US economy is finally restrained by the cumulative tightening in monetary conditions from Quantitative Tightening (QT) and interest rate hikes.
There are a number of structural reasons why the FOMC has lowered its assumption for neutral interest rates over the past 5 years, including the implications of changes in demographics, lower productivity and stronger demand for safe assets.
An outstanding question is whether the upcoming US fiscal stimulus is significant enough to be a factor that lifts the long-run resting place for US interest rates.
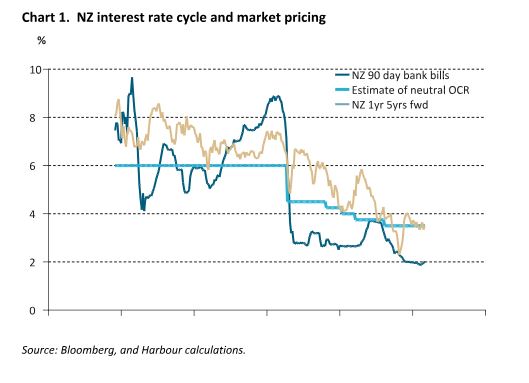
Repeating the same analysis for New Zealand draws out similarities and differences.
We know that the RBNZ modelling assumptions for the neutral OCR have also been falling, initially as a step-change lower after the GFC and then more gradually through time and sits at around 3.5-4.0%.
Since the GFC, the market’s own pricing of the long-run neutral rate (as proxied by the implied market one-year rate five years ahead) has typically sat above the RBNZ neutral estimate.
However, like the United States, in recent years these have converged so that the central bank and market are already factoring in a similar resting place for the OCR in around five years’ time.
The difference with New Zealand is that the current OCR, at 1.75%, still sits a long way south of the neutral OCR of 3.50-4.00%. For some time now, the RBNZ has used the narrative that the OCR will remain low for a considerable time and that message was reiterated by the new Governor, Adrian Orr, in his first Monetary Policy Statement in May.
In the United States, the unemployment rate recently hit a new post-GFC low of 3.8%, and continued job growth suggests domestic inflation pressures are likely to build.
In this environment, we expect the US Federal Reserve to continue its hiking cycle. Indeed, it could create a scenario where the US Fed Funds rate needs to overshoot its neutral level to contain wage and pressure pressures.
We will be monitoring whether strain in the financial system or credit markets emerge that curtail the cycle; equally we will be watching for signs of whether US fiscal stimulus and tax changes provide further legs to the economic expansion and, especially, whether it results in stronger private sector CAPEX.
In New Zealand, while the message that the RBNZ is on hold for now is loud and clear, we are looking for when enough evidence has built to move away from this narrative. In coming months, inflation may rise to 2.0% as higher oil prices and the fall in the New Zealand dollar combine to lift headline CPI inflation.
Historically, the RBNZ would look through currency and oil-driven changes, but a lift in inflation towards 2% may help the process of inflation expectations lifting to become more consistent with target, which the RBNZ would likely welcome.
Furthermore, the well-publicised changes in minimum wages and high-profile public sector pay claims are an added factor in the wage and price-setting dynamic to monitor.
The RBNZ will have a high threshold of evidence before they signal the commencement of a hiking cycle. But, when the facts change, so will policy stance and interest rate markets.
In our portfolios, we are modestly short duration in our fixed interest funds, and underweight bond proxies in our equity funds.
Important disclaimer information
| « Solving Japan’s financial problems…and creating some for New Zealand | The Right Benchmark is the Bedrock of Strong Active Management » |
Special Offers
No comments yet
Sign In to add your comment

© Copyright 1997-2026 Tarawera Publishing Ltd. All Rights Reserved