
by Andrew Hunt
In effect, both are the markets’ valuation of different types of income stream and we can of course imagine that at times the markets may prefer the ‘certainty’ of a bond, while at other times they may need the flexibility or upside of the income that can be gained from owning equities.
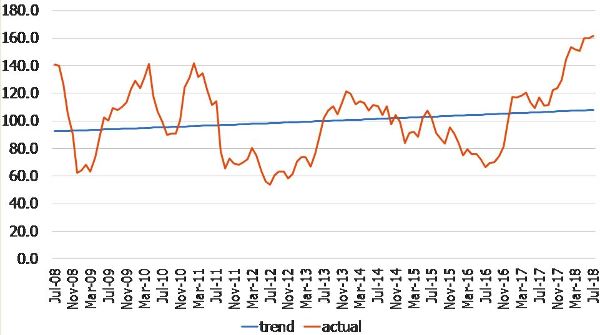
Market strategists have of course long been used to comparing these two valuations (yield gaps or yield ratios be the most common methods) and attempting to identify just when one valuation may be looking extended in comparison to the other. We have conducted just such a broadly conventional exercise in the chart below, simply by using the Shiller PER for the US Standard and Poor’s index compared with the 10-year Treasury bond price, using data for the last ten years.
Measured by this basic metric, US equities seem at present to be relatively expensive in comparison to bonds and, with the consensus currently expecting bond prices to fall still further, one could argue that equity prices are beginning to look quite vulnerable to a significant correction.
However, we are also only all too aware that the results of comparisons such as these are all too dependent on the sample period used.
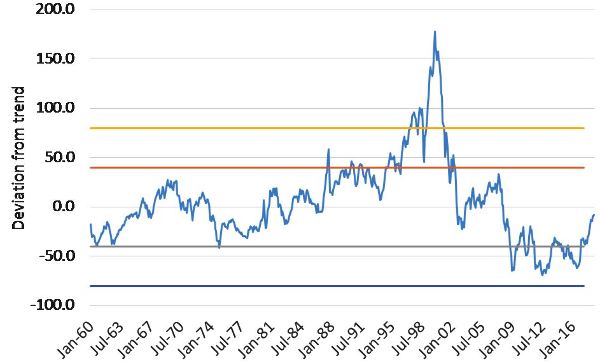
If we instead look at data for the last 60 years, we find that equity price earnings ratios currently look extremely ‘average’ in relation to bond prices at present and on this basis, there would seem to be no reason to expect equity prices to under-perform bond prices.
Indeed, given the serial correlation in the data, we might expect the data in the chart to move higher in the near term (i.e. the line usually oscillates from one standard deviation expensive or cheap to the other extreme, the data rarely stays ‘in the middle’).
We note this ‘time period sensitivity’ within these models not just out of academic curiosity. Increasingly, we are seeing a lot of ‘valuation work’ (particularly that used by pension advisors and the like that is based only on a 10-year sample period), even though this period now by and large excludes the GFC.
This would seem to imply that the authors of this analysis are assuming that the last 10 years have represented ‘normal times’ despite of all of the unprecedented and extraordinary policy events that we have all witnessed since the GFC.
Similarly, we are also becoming all too aware of just how old we are – to have worked before and during the GFC one probably now has to be in one’s mid or late thirties or older, while the NASDAQ Bust requires you to be in your forties, the Gulf War / S&L / Japan Crisis require one to be in your fifties.
Apparently, the average age of the analysts in a major US investment bank is now 29 and we certainly observe that there are now very few portfolio managers left that can remember first-hand the early 1980s high real interest rate period, let alone the inflation-prone 1970s.
Even more surprising to us at a personal level is the dearth of EM managers that were around during the 1997-8 Crises (which may explain why these seem to be repeating themselves).
On the basis that people form many of their opinions quite naturally on the basis of their own experience sets (in a way that is in many respects just like the more formal statistical models we show above), one’s age probably influences quite significantly how you ‘feel’ about markets.
Today’s S&P might well look expensive to a 29-year-old but cheap to a veteran of the NASDAQ Bubble or Japan’s Bubble Economy.
Returning to our second longer term chart that we show above, we note that the ‘break out’ in the data seems to have occurred around the middle or perhaps latter part of 2017.
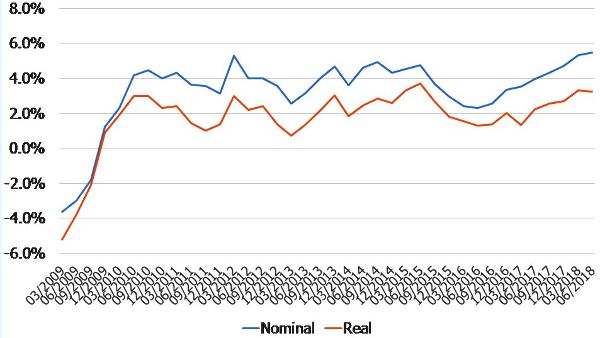
One could argue that this did indeed represent a period regime change in the real economy: the second half of 2017 saw US nominal GDP growth (and nominal GDP in several other countries) begin to expand at rates that had not been seen since well before the GFC (US nominal GDP growth was apparently ‘stuck’ at less than 4% between 2009 and mid-2017 but over the last 12 months the growth rate of GDP has moved towards a more ‘normal’ 5%).
One could therefore argue that, since the economy has been normalizing, so too should the ratio between GDP-sensitive equity valuations and GDP insensitive bond prices.
Indeed, in a world of accelerating nominal GDP, equities probably should be re-rated relative to bonds and hence our longer time period model would seem more relevant than our ten year Post GFC model.
In fact, we have already seen the impact that the achievement of a 5% rate of nominal growth has had on policymakers.
The guidance from the Federal Reserve under Powell has been very different to that which was offered under Bernanke or even Yellen and the Fed’s message at present is very much one of normalization away from the Post GFC policy era.
In particular, the Fed’s message is now very much one of rising interest rates and of course a rundown rather than increase in the Federal Reserve’s current massive bond portfolio.
According to the Fed’s own data, during the various QE phases, the Federal Reserve purchased on average 70% of the net issuance of T bonds and that by the end of QE3 the Fed directly owned more than 17% of all the T bonds then in existence (and the Federal Reserve was relatively less active in the US bond markets than the ECB or BoJ were in their own markets).
Such a massive level of state involvement in the bond markets was unprecedented in the context of a peace-time economy and clearly the rise to prominence of such large non-profit-maximizing state-owned entities in the bond markets will have changed ‘how the bond markets worked’.
Certainly, the involvement of the Fed will have helped to inflate the bond markets (again, the Federal Reserve was by no means the worst offender in this endeavor in comparison to its global peers), while at the same time the fact that the Fed needed to do this may have undermined confidence in the ability of corporates to produce earnings growth and so encouraged equities to trade at a discount.
However, if the economy is now recovering and the Fed is both acknowledging and confirming this by announcing that it no longer sees a requirement to remain involved in the bond markets, then presumably the situation should be reversing, and equities should re-rate to a more ‘normal longer-term valuation’ versus bonds.
Clearly, the conclusion that follows from this is that, if the US nominal economy and the Fed are indeed ‘normalizing’ back to the type of conditions that existed prior to the GFC – and the achievement of more than 5% nominal GDP growth would seem to signify as much - then equities may be expensive relative to bonds in the context of the Post GFC era but they are fairly priced relative to bonds in the context of a more normal period.
The question then becomes whether the economy really has broken out of its post GFC lethargy? The headline nominal GDP data and the sentiment in the media certainly suggests that this is the case but in reality much of the US economic data is not quite as strong as some would have us believe: the capital spending data is better but not exceptional and the retail sales data still seems anchored to its post GFC trend.
Government spending is expected to provide a lift to GDP growth but the prospects for the US’s external accounts seem to be clouded in uncertainty.
Left to its own devices ‘in a vacuum’, we suspect that the US would be able to continue to emerge from the Post GFC hangover (even the productivity data has improved) but, in a globalized world, the US is certainly not operating in a vacuum. Indeed, just as a Western recession de-railed China’s economy in 2008-9, we wonder if a looming recession in the PRC may cause the US (and others) to abort their take-offs and instead return to their post GFC forms of behaviour and relative valuations.
For many, the thought of a recession in China is unthinkable. To return to our earlier theme, if you have covered China for less than fifteen years you may only have experienced (reported) economic booms and temporary slowdowns but if you have a longer experience set, one might remember the 1997 slump, the 1994 stagflation / devaluation crisis and perhaps even the intense volatility of the late 1980s.
There is also the question of data reliability and (self) censorship.
Single-party states of any ilk or nationality usually attempt to justify their systems through economic success (the LDP in Japan 1950-1990 being the most celebrated example, but one might also include Lee Kwan Yew-era Singapore, Taiwan in the 1970s and 1980s, and even the Hong Kong system in this group).
These regimes tend not to like their economic management being questioned (as the author discovered first-hand in 1992 when he incurred the wrath of LKY) and it is not unknown for data series to be discontinued or ‘altered’ when it suits the government; we certainly remember an ASEAN state (or two) deliberately fiddling their trade account data in the mid-1990s. As a result, some of the economic data may not be reliable but at the same time the ‘consensus’ institutions will tend not to challenge any suspect data, less they lose their operating licenses or face investigation.
Investment banks being closed down and economists being arrested were not unknown events in the 1990s in a number of Asian countries whenever they incurred the wrath of the often very sensitive authorities.
However, while the authorities can hide or suppress data and analysis for a time, there is always a tendency for the truth to emerge. Thailand may have chosen not to publish its trade price data and by implication its corporate financial and profit data throughout 1996-7 but ultimately some macro analysts found a way to model the data and a few bottom-up analysts were also able to confirm the true extent of the Thai corporate sector’s borrowing requirements – and its likely funding gap.
The result was that the Thai equity market shifted from being one of the Region’s better performers in 1996 (on the back of what ‘seemed’ like strong data) to crashing when the true extent of the economy’s problems were finally revealed. Quite simply, when the truth emerged, sentiment had to shift 180 degrees and the resulting market moves were violent.
This is of course in marked contrast to the way that stories tend to evolve in more open systems.
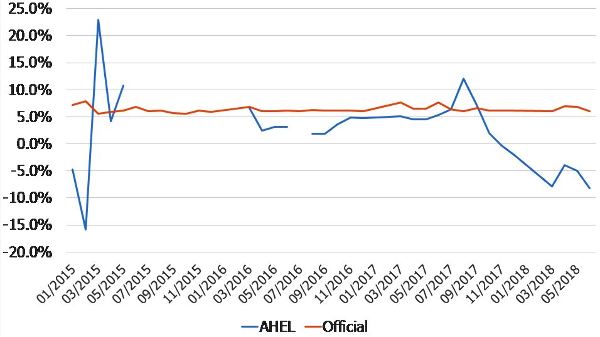
This year, China’s statisticians have shifted the way in which they report some of China’s output data. Now, if a company in the industrial production data sample closes, it is not only excluded from the current survey it is also removed from the historical data.
This is akin to a portfolio manager being able to exclude any stocks that went down when reporting their performance data! However, if we construct a like-for-like estimate of China’s production data, we gain a very different picture from that offered by the headline data.
Moreover, this revised data does not seem to differ markedly in terms of its message from that offered by several of the other North Asian economies – the most recent data from Korea, Japan and Taiwan has all seemed notably soft.
We remain convinced that China’s credit and falling savings-rate driven ‘mini-boom’ in late 2016 and early 2017 was instrumental in causing, and fundamental in sustaining, the 2017 global recovery. Certainly, China’s economy contributed much of the growth in global nominal GDP in 2017 and we believe the majority of the expansion of world trade that was so instrumental in broadening the recovery into Europe and the EM.
However, if China’s economy is slipping into recession-like rates of growth (and this week we have observed further evidence that global trade volumes are slipping), it will jeopardize the global economy’s – and by implication the US’s – ability to finally escape the Post GFC lethargy.
We therefore fear that there is a risk, made more severe by the nature of economic reporting in Asia – that the consensus will have to radically alter its ‘view’ of the likely trajectory of the global economy and to reconsider whether the West really will be able to normalize its financial markets (and this need for a revision of forecasts may become all the more pressing if the Fed inadvertently tightens into a global slowdown – something that is not impossible given the pressure on the Fed to shrink its balance sheet for largely political reasons).
Specifically, if events in Asia cause the global economic recovery to falter, then arguably we should return to our ’10-year view’ of history and on that basis, equity markets would indeed seem expensive at this time.
It is for this reason that we believe that markets and investors should be focusing not only on Powell and the outlook for monetary policy within the US and OECD for their risk factors, they should also be paying very close attention to Asian economic trends as we approach the end of the year.
Andrew Hunt International Economist London
| « Investing: Understanding non-financial risks | Investing: The Good-Bad-Good of Share Buybacks » |
Special Offers
No comments yet
Sign In to add your comment

© Copyright 1997-2026 Tarawera Publishing Ltd. All Rights Reserved