

Putting 2002 in context
After another tough six months in equity markets, most diversified superannuation funds ended 2002 with a fall in value. The median return for the year for balanced and growth funds in a recent Mercer Investment Consulting survey was negative 7.3 per cent. No one likes to see his or her capital go backwards. Naturally there is a tendency to wonder whether the funds would be better placed in an alternative area going forward (say in cash or housing).
Given these concerns, it is worth revisiting some of the points we made in July last year after negative returns were reported for the financial year.
Several points are worth noting.
1/ The key driver of returns for an investment fund is the asset classes in which the funds are invested. The most common superannuation funds have 60-70 per cent of their funds invested in equities (both in New Zealand and offshore). This is because over the long-term equities provide higher returns than other asset classes.
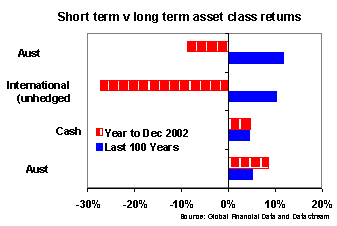
This does mean though that equity markets are the key drivers of performance for such funds. The problem over the past year has been that global equity markets delivered a negative 27.4 per cent return, Australia negative 8.8 per cent and the NZSE40 a barely positive 0.88 per cent. The generally positive return on other asset classes was not enough to offset these very poor equity returns.
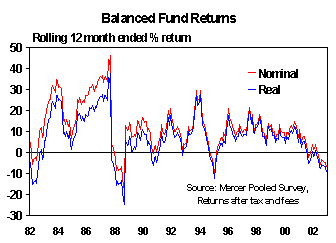
2/ The historical record suggests that balanced funds have negative returns every seven years or so. Negative returns, ie capital losses, occurred in the early 1980s, after the 1987 crash, in 1994 (due to falls in both the equity & bond markets) and more recently. Equity market falls were a key driver in each of these episodes. In real terms, ie after subtracting inflation, the loss over the last year or so is quite minor compared to the negative real returns experienced in 1982 and 1987-88.
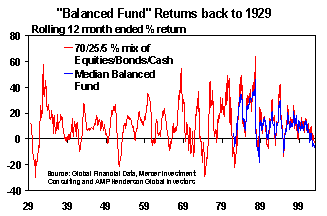
3/ To provide a longer-term guide (as balanced funds only came into existence in the 1970s), the next chart is constructed on the basis that an investor invests 70 per cent in Australasian equities and 25 per cent in Australasian bonds and 5 per cent in bank bills (ie, cash). The chart only goes back to 1929 because we do not have a monthly time series for bank bill returns prior to July 1928. It also excludes exposure to global assets because again we do not have a long term monthly time series for aggregated global equities and bonds and in any case investment in international assets was limited prior to the 1980s. For comparison, returns for balanced funds in the Mercer Investment Consulting survey since 1982 are shown on the same chart.
This series would be more volatile than a typical balanced fund of today given the limited number of asset classes and the absence of property, all of which results in less diversification. However, once again it clearly suggests that a period of negative returns every few years seems to be a normal cyclical phenomenon and should not be seen as a reason for excessive alarm.
4/ To some degree the poor returns of the last few years reflects a payback for returns which were way above average during the 1990s.
Nominal
Real
1900-2001 Click the button below to subscribe and will have free unlimited access for a limited time to full article and all other articles on the site. You will also be able to comment on articles on Good Returns.