

Household savings rate far from impressive
Richard Flinn runs the rule over the nation's savings rate.
Wednesday, June 10th 1998, 12:00AM

Household savings in financial assets do not appear to have been particularly strong over the last two quarters. This is significant because most commentators have been expecting that savings rates will increase this year as consumer confidence wanes. It is normal for savings rates to rise during times of economic slowdown, as households reduce spending plans and become more cautious.
However, the data has yet to support this theory. Despite the surveys pointing to consumer confidence being at its lowest since the 1990-91 recession, households have yet to translate this into higher savings.
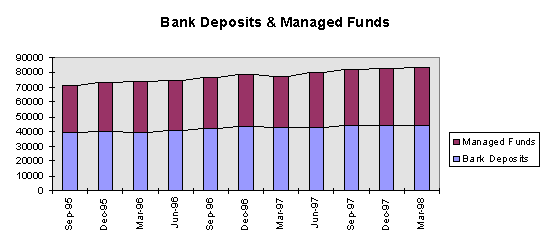
Over the past two and a half years, household savings in bank deposits have increased from just on $39bn to $44.58bn as at March 1998. Household investment in managed funds has increased from $31.9bn to $38.9bn. This increase comes from two sources potentially. The first would be from new savings out of salary and wages. The second would be from compounded investment return on existing savings.
A good savings rate would be one where both new savings were considerably ahead of inflation, and investment gain was being substantially compounded into the existing savings pool.
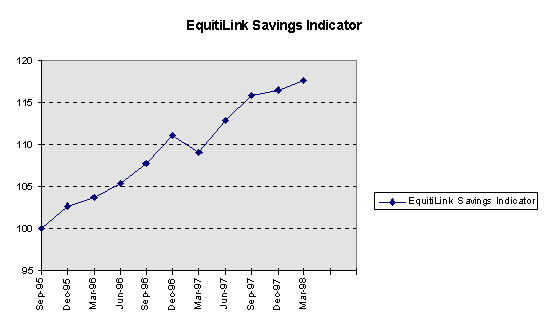
The above graph indicates that the rate of increase in both managed funds and bank term deposits has been fairly close. The average annual savings rate into bank deposits over this period was 4.32 percent. The average savings rate into managed funds (both retail and wholesale) was 6.10 percent.
At first glance this seems to be a reasonable savings rate because it is ahead of inflation.
However, the household savings rate is actually far from impressive. Over the same time period, the average annual after tax return on bank term deposits, according to Reserve Bank figures, was 4.75 percent. In other words, effectively no new net savings are going into bank term deposits.
Similarly, the average after tax market return on the managed funds savings pool has averaged around 6.5 percent over the same time period. Therefore, for managed funds the situation is the same. With a savings rate into managed funds of 6.10 percent and an earnings rate of around 6.5 percent, effectively no new net savings are going into managed funds.
The savings rate of New Zealand households over the past two and a half years represents no more than the compound earnings of the existing asset pool. No net fresh savings have been added.
The Equitilink household debt indicator
There are two basic categories of household debt: mortgage borrowing to fund the family home and consumption borrowing to fund the purchase of consumer goods. The increase in total household debt (mortgage and consumption) is shown in the EquitiLink household debt indicator.
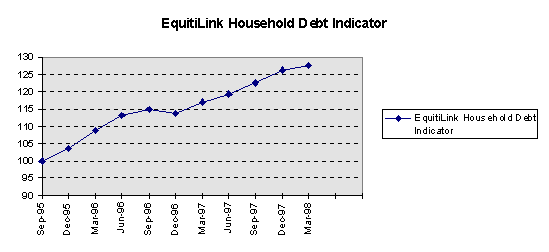
Source: EquitiLink Investment Management, derived from data sourced from the Reserve Bank of New Zealand
This indicator tracks the borrowing appetite of New Zealand households. It shows that during the 1997 year, the rate of borrowing was beginning to slow down.
The debt indicator also shows that household borrowing in the most recent quarter is beginning to ease. This could well be the first indication of a trend towards increased household savings.
When the data is broken down, it shows that both mortgage borrowing and consumer borrowing have slowed, with consumer borrowing slowing more sharply than mortgage borrowing.
The next two quarters data will be critical. If household borrowing continues to slow, it will confirm that the residential housing market has become a less attractive sphere for household savings. If consumption borrowing also continues to ease, it will imply that households are tending to save, rather than consume the additional income from the tax cuts.
The Equitilink savings and debt indicators compared
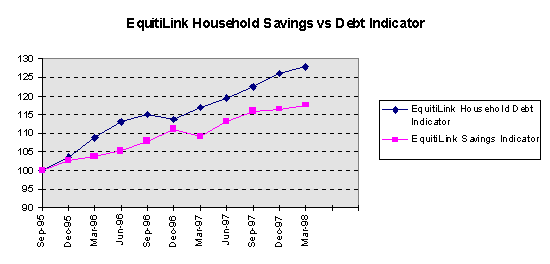
Source: EquitiLink Investment Management, using data sourced from the Reserve Bank of New Zealand
In the last two quarters, the household debt indicator has moved back up above the savings indicator. This implies that the appetite for borrowing (although slowing) has been increasing at a faster rate than household savings.
Consumer borrowing has been static over the last two quarters. Mortgage borrowing has also crept up, albeit at a slow rate than in late 1995 and early 1996.
| « South East Asia: A window of opportunity? | King builds an empire » |
Special Offers
Commenting is closed
|
|
Printable version |
|
Email to a friend |

