

Can active managers outperform the index?
In the first of a two part series FPG Research asks; can active investment managers outperform the market after tax and expenses, and if they can, can they do so on a consistent basis?
Saturday, July 11th 1998, 12:00AM

This article analyses the performance and characteristics of five selected actively managed New Zealand equity unit trusts, three passively managed equity trusts, and the NZSE30 Gross Index, to provide some answers to the question; can active investment managers outperform the market after tax and expenses?
Active and passive investments
A passive investment by definition is one that holds every security in the market in the same proportion as represented in the market.
An active investment is unlikely to hold the same weightings as the market. The managers of active investment portfolios believe that they can add value to the investment by moving away from market benchmark weightings. Even if the holdings of the actively managed investment were the same or similar as the market, the weightings of the holdings within the active portfolio would be different, and would be changed over time.
Sharpe (1991) states that: "Because managers usually act on perceptions of mispricing, and because such misperceptions change relatively frequently, such managers tend to trade fairly frequently - hence the term active."
Sharpe also states that:
- before costs, the return on the average actively managed dollar will equal the returns on the average passively managed dollar; and
- after costs, the return on the average actively managed dollar will be less than the return on the average passively managed dollar.
Sharpe claims that these assertions will hold for any time period.
Nature of this analysis
The analysis examines the performance and characteristics of five selected New Zealand equity unit trusts with at least four years' performance history. The trusts were selected because they had either consistently received FPG Research Star Ratings of four or five stars over the past three years; or if they did not have those star ratings they have been ranked in the top 10 by FPG Research's quantitative rating for their investment subcategory and they have at least four years of performance history.
The five New Zealand equity unit trusts selected for this analysis are: the Armstrong Jones NZ Share fund, Tower New Zealand Equity Trust, WestpacTrust NZ Share Index Plus Trust, National Mutual NZ Leaders Trust and the New Zealand Funds Management NZ Equity Trust.
All of these managed investments can be classified as being managed actively, although their degrees of investment management activity vary. Each product has a different mandate and different investment objectives.
The following analyses were used to assess the performance relative to the market of the five trusts identified as superior by FPG Research, and to ascertain whether any of these products have been able to outperform the market on a regular basis: total return, risk-adjusted return, style analysis and fee analysis.
Passive investment comparison
The three passively managed investments selected for comparative purposes are the: the AMP Investment Tracker Fund, the New Zealand Guardian Trust NZGT30 Fund and Tower's Tortis NZ fund.
Long-term historical analysis of their performance was not possible as these funds each have less than two years' performance history. To overcome this the NZSE30 Gross Index was used as a surrogate for long term performance. The NZSE30 Gross Index was selected as the benchmark because it has a similar composition to the NZSE40 Gross Index, but does not include securities that are not traded regularly, and is therefore a more applicable index for practical comparisons.
The performance of this Index was adjusted for income tax and fees at 0.78 percent annually (the average amount charged by passive managed investments). The adjustment for income tax was calculated by taking the difference between the monthly returns of the capital index and the gross index. This difference was assumed to be the income return, was reduced by 33 percent, and was then added back into the capital index on a monthly basis. Performance figures for the selected managed investments were calculated net of tax and fees (apart from entry and exit fees).
Three of the selected actively managed trusts (the Armstrong Jones, Tower and New Zealand Funds Management funds) outperformed the NZSE30 Gross Index on an adjusted basis over the four years measured.
Year-on-year performance
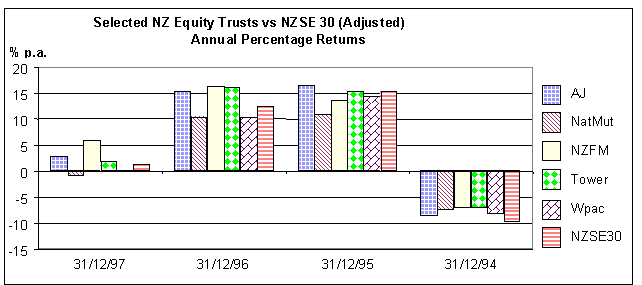
Graph one below shows the year-on-year performance of the five actively managed New Zealand equity trusts and the NZSE30 Index (adjusted). The graph shows that all of the selected products matched or outperformed the index over some or all of the annual periods measured.
Graph 1: Selected New Zealand Equity Trusts Vs NZSE30 Index (Adjusted) Annual Percentage Returns, Dec 31/94 to Dec 31 /97
Active and passive performance compared
So far, we have determined that three of the five selected actively managed equity trusts were able to outperform the index over the four years. But how did the selected passively managed investments fare?
Table one below ranks the combined performance of the five active products, the NZSE30 Gross Index, and the three passively managed trusts. (The timeframe of this performance analysis was the fourteen months from February 1997 - April 1998).
Table 1: Combined performance ranking of selected active and passively managed New Zealand equity trusts, February 1997 - April 1998
|
Rank |
Fund |
|
1 |
NZ Funds Management NZ Equity Trust |
|
2 |
Armstrong Jones NZ Share Fund |
|
3 |
Tower NZ Equity Trust |
|
4 |
NZSE30 Index (Adjusted) |
|
5 |
AMP Investment Tracker Fund |
|
6 |
Tower Tortis NZ |
|
7 |
NZ Guardian Trust NZGT30 Fund |
The taxation advantages and lower fee structures of most passive investments may have led to the assumption that these products would be able to match, if not exceed, the performance of the higher-performing selected actively-managed trusts.
Although the results shown in table one cover only a relatively short timeframe, they do show that in the 14 months the selected passively-managed investments have all been in the New Zealand market, that they have not been able to meet the returns of the NZSE30 Gross Index after adjustments for income tax and fees.
Part two of this article will use risk/return analysis, style analysis, and fee analysis to complete the assessment of the performance of the selected actively managed investments compared to the NZSE30 Gross Index
Janet McLeod is manager of FPG Research Star Ratings.
| « Growing the Savings Dollar | King builds an empire » |
Special Offers
Commenting is closed
|
|
Printable version |
|
Email to a friend |

