

Some Dividend Yields Are More Equal Than Others
Selecting investments for dividend yield is a matter of balancing the level of return with the future reliability of returns. Cameron Watson explains what factors need to be considered.
Thursday, July 15th 1999, 12:00AM
 When selecting companies for dividend yield, investors are seeking those that not only have a high relative yield but also have the ability to sustain this yield. Selecting investments for dividend yield then becomes a matter of balancing the level of return with the future reliability of this return. There are a number of factors that can help investors weigh-up the quality of dividend yields.
Dividend Payout Ratio
This ratio measures the proportion of earnings paid to shareholders as dividends. It is a highly significant indicator of the company's ability to maintain or grow its dividend payouts in future. Lower payout ratios normally reflect higher growth potential while higher payout ratios may point to a mature company with limited scope to grow.
A company that only distributes 50 per cent of net profit to shareholders as dividends has considerably more ability to maintain this dividend than a company that distributes 100 per cent of earnings. If the latter company's earnings decline so must its dividend payout whereas a company with a lower payout ratio may still have the potential to maintain its dividend payout on reduced profits.
As can be seen from this sample of companies, growth companies tend to have lower payout ratios than more mature businesses like Telecom and TrustPower. Property companies often have payout ratios of 100 per cent or more, reflecting the income orientation they have. However, it raises the spectre of reduced dividends if capital expenditure requirements impact on future earnings.
Payout ratios that are greater than 100 per cent can occur when a company either uses it credit lines (borrows) or has a high depreciation (non cash) element to its costs.
|
A sample of payout ratios from the NZ Top 40 companies |
|
|
Company |
Payout ratio (%) |
|
Kiwi Income Property Trust |
123 |
|
St Lukes Group |
114 |
|
DB Group |
100 |
|
Telecom |
96 |
|
TrustPower |
90 |
|
Warehouse |
69 |
|
Sanford |
56 |
|
Air New Zealand |
49 |
Dividend Track Record
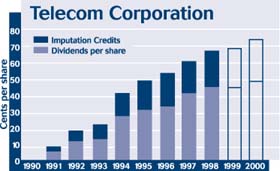
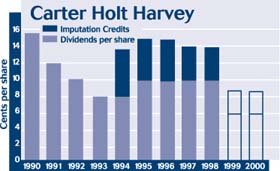
Companies with a history of consistently growing dividends per share should be preferred over those with more erratic track records. Volatile dividend payouts are indicative of cyclical companies which are subject to external pressures outside their control.
Compare the consistent growth from Telecom to the cyclical swings from Carter Holt Harvey in the following charts showing the dividends per share over the 1990s.
Do Not Calculate This Year's Yield Using Last Year's Dividend
It is very important to ascertain the expected dividend payout for the current year and make an estimation of the dividend yield on this basis. It is dangerous to make assumptions based on last year's dividend payout. For instance, The Herald dated 22 April has the dividend yield for Trans Tasman Properties (based on the past 12 months dividend payments) recorded as 6.25 per cent. In reality, Trans Tasman Properties will not be paying a dividend this year and is not expecting to make any dividend payments until the second half of 2000. Clearly, a more accurate current yield on Trans Tasman is zero.
Fundamental Research On The Company
Elements such as the quality of management, the outlook for the industry or sector in which the company operates and the company's growth strategy are all very important matters to consider. They are impossible to measure numerically but without an understanding of these elements all other numerical analysis can be meaningless or even misleading.
A Sample Of Quality Dividend Stocks
The companies listed below have, in our view, a good combination of high relative yield, dividend track record and payout ratio, together with a sound fundamental outlook, and should continue to provide investors with relatively high dividend yields. Once again, the property companies and trusts should be considered carefully in light of their higher payout ratios which may impact on future dividends.
For investors who do not have an immediate requirement for high income there is an alternative to these high income companies that can be particularly worthwhile over time. It necessitates foregoing a high dividend yield now for a higher one in the future. Investors who purchase quality growth stocks such as Auckland Airport or The Warehouse can expect greater total reward (via income and share price appreciation) and higher actual income in 5 years time.
For instance, The Warehouse distributed 14 cents per share over 1998 and has a current dividend yield of 5.1 per cent. Over the past 5 years the company has increased dividends per share by over 50 per cent a year. If it can maintain growth at half this rate it will result in a dividend of 42 cents per share in 2003 and a gross yield of 9.0 per cent for investors buying shares at todays' price of $7.15.
Likewise, Auckland Airport is expected to distribute 5.5 cents per share over 1999 and at the current price of $3.05 is trading on a gross yield of 2.7 per cent. Should Airport achieve a growth rate of 20 per cent per annum the dividend in 5 years' time will be 13.6 cents per share, resulting in a gross yield at that time of 6.7 per cent.
|
|
Share price |
Forecast 1999 DPS (cps) |
Forecast 1999 yield |
Imputation (%) |
Payout ratio |
5yr Average Growth in DPS (% pa) |
|
|
Air NZ |
$2.80 |
14 |
6.2 |
50 |
49 |
21 |
|
|
Cavalier Corporation |
$3.30 |
26 |
11.7 |
100 |
89 |
2 |
|
|
DB Group |
$2.39 |
21 |
13.1 |
100 |
100 |
24 |
|
|
Infratil |
$1.54 |
4.8 |
4.7 |
100 |
85 |
22 |
|
|
Hallensteins |
$2.80 |
18 |
9.6 |
100 |
95 |
13 |
|
|
Sanford |
$4.20 |
16 |
5.7 |
100 |
56 |
6 |
|
|
Sky City Installment Receipts* |
$4.26 |
40.5 |
14.1 |
100 |
89 |
15 |
|
|
Sky City |
$7.62 |
40.5 |
7.9 |
100 |
89 |
15 |
|
|
Telecom |
$9.29 |
46 |
7.4 |
100 |
95 |
29 |
|
|
TrustPower |
$3.66 |
14.5 |
5.9 |
100 |
90 |
54 |
|
|
Wilson & Horton** |
$7.85 |
40 |
7.6 |
100 |
47 |
0 |
|
|
Property Trusts and Companies |
|||||||
|
AMP Property Trust |
$1.02 |
9 |
8.8 |
0 |
64 |
0 |
|
|
Kiwi Income |
$1.01 |
9.5 |
10.1 |
14 |
123 |
21 |
|
|
National Property Trust |
$1.00 |
7.2 |
9.1 |
52 |
87 |
2 |
|
|
Property for Industry |
$0.78 |
6.2 |
9.4 |
36.5 |
108 |
4 |
|
|
St Lukes Group |
$1.82 |
12 |
7.1 |
20 |
114 |
13 |
|
*The Sky City Instalment Receipts are partly paid and require a final payment of $3.55 per share due in March 2000. At this time the yield will revert to that of the ordinary share which is currently running at 7.9 per cent.
**Wilson & Horton is an exchangeable preference share. One WHHPA either converts into one share in the Irish parent, INWS (the current price of INWS is £3.10, which equates to approx. NZ$9.00), or the holder can elect to redeem it for its cash face value of NZ$8.00. The share matures/converts on 30 November 2003. WHHPA pays a fixed annual dividend of 40¢ (20¢ each in November and June). Each dividend payment will carry full imputation credits provided that earnings and tax payments by INWS subsidiary, Wilson & Horton, owner of the NZ Herald, do not significantly fall, or that INWS otherwise ensures that NZ tax payments are sufficient.
This newsletter is a condensed version of Craig & Co's NZ Dividend Trends Book.
Disclaimer: While this report is based on information from sources which Craig & Co Limited considers reliable, its accuracy and completeness cannot be guaranteed. Craig & Co Limited, its partners and employees do not accept liability for the results of any actions taken or not taken upon the basis of information in this report, or for any negligent mis-statements, errors or omissions. Those acting upon information and recommendations do so entirely at their own risk. Craig & Co Limited and/or its partners and employees may, from time to time, have financial interest in respect of some or all of the matters discussed.
| « Compulsory adviser registration far from dead | King builds an empire » |
Special Offers
Commenting is closed
|
|
Printable version |
|
Email to a friend |

