tmmonline.nz  |   landlords.co.nz        About Good Returns  |  Advertise  |  Contact Us  |  Terms & Conditions  |  RSS Feeds

NZ's Financial Adviser News Centre

GR Logo
Last Article Uploaded: Thursday, September 19th, 6:46PM

Mortgages

Mortgage Rates Daily Commentary
Saturday 14 September 2024  Add your comment
Your Weekend Listen: Hear the latest from Prospa

Prospa NZ managing director Adrienne Begbie joins the TMM Better Business podcast to discuss opportunities for mortgage advisers. Click here to see some of the things she covers in this podcast.

LISTEN TO THE FULL POCAST ON THESE PLATFORMS


rss
Latest Headlines

Kiwi appetite for housing debt seems to be abating

New Zealanders’ appetite for debt, mostly put to use in buying property, seems to have at last abated after a decade of giddy growth, according to the Reserve Bank.

Monday, July 9th 2001, 12:03PM

by Jenny Ruth

Growth in household debt slowed to 6% in the year ended May from 8.4% in the previous year. That’s the slowest rate of growth of borrowing experienced for more than 20 years, say Clive Thorp and Bun Ung in the Reserve Bank’s latest bulletin.

Almost 91% of the $71.9 billion New Zealanders owed at the end of May was in housing loans.

As Thorp sees it, since the banking system was liberalised in 1985, we’ve been catching up with patterns seen in other OECD countries with similar banking systems.

The growth in debt was certainly phenomenal. As a percentage of disposable income, household financial liabilities almost doubled in the decade to 2000. Debt is now at about 110% of disposable income.

"In other similar countries, it hasn’t carried on getting higher. It’s sometimes declined. It looks like 100% to 120% is what countries do when they have banking systems like ours," Thorp says.

During the course of this borrowing spree, household financial assets have increased 80% in real terms since 1980 while household liabilities have increased 240%, his article shows.

In 2000, housing represented more than 80% of the net wealth of New Zealand households, an increase from under 70% in 1980.

Household real net financial wealth (financial assets less liabilities), which was relatively constant from 1985 to 1995, has declined over 20% since then.

Net household wealth as a ratio of personal disposable income has declined over 10% from its peak in the mid-1990s to a level now similar to that of the mid-1980s.

"In 2000, there has been some evidence that the pace of housing investment has slowed. Over the next five years we might expect to see some improvement in the value of the gross net financial assets of households as they rebalance their wealth holdings," it says.

The article also concludes that the borrowing needs of New Zealand households are well catered for, even though household debt is highly concentrated with five large banking groups holding over 90%.

"The lending market’s high degree of concentration is associated with vigorous competition for market share and efficient delivery of home loans," it says.

Household debt as a percentage of nominal disposable income
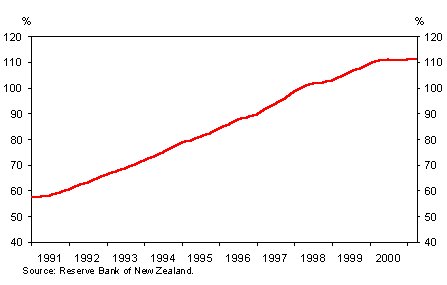
« RB leaves cash rate unchangedInterest rates continue to rise »

Special Offers

Commenting is closed


print

Printable version  

print

Email to a friend
Mortgage Rates Table

Full Rates Table | Compare Rates

Lender Flt 1yr 2yr 3yr
AIA - Back My Build 5.94 - - -
AIA - Go Home Loans 8.49 6.45 5.89 5.79
ANZ 8.39 6.95 6.39 6.39
ANZ Blueprint to Build 7.39 - - -
ANZ Good Energy - - - 1.00
ANZ Special - 6.35 5.79 5.79
ASB Bank 8.39 6.45 5.89 5.79
ASB Better Homes Top Up - - - 1.00
Avanti Finance 8.90 - - -
Basecorp Finance 9.60 - - -
BNZ - Classic - ▼6.29 ▼5.79 5.79
Lender Flt 1yr 2yr 3yr
BNZ - Mortgage One 8.44 - - -
BNZ - Rapid Repay 8.44 - - -
BNZ - Std 8.44 6.45 5.89 5.79
BNZ - TotalMoney 8.44 - - -
CFML 321 Loans 6.70 - - -
CFML Home Loans 6.95 - - -
CFML Prime Loans 8.75 - - -
CFML Standard Loans 9.70 - - -
China Construction Bank - 7.09 6.75 6.49
China Construction Bank Special - - - -
Co-operative Bank - First Home Special - ▼6.15 - -
Lender Flt 1yr 2yr 3yr
Co-operative Bank - Owner Occ 8.15 ▼6.35 ▼5.79 ▼5.69
Co-operative Bank - Standard 8.15 ▼6.85 ▼6.29 ▼6.19
Credit Union Auckland 7.70 - - -
First Credit Union Special - 6.75 6.35 -
First Credit Union Standard 8.50 7.35 6.95 -
Heartland Bank - Online 7.99 6.69 6.35 6.15
Heartland Bank - Reverse Mortgage - - - -
Heretaunga Building Society 8.90 7.00 6.50 -
ICBC 7.85 6.45 5.99 5.89
Kainga Ora 8.39 7.05 6.59 6.49
Kainga Ora - First Home Buyer Special - - - -
Lender Flt 1yr 2yr 3yr
Kiwibank 8.25 ▼7.19 ▼6.69 ▼6.59
Kiwibank - Offset 8.25 - - -
Kiwibank Special - ▼6.29 ▼5.79 ▼5.79
Liberty 8.59 8.69 8.79 8.94
Nelson Building Society 8.75 6.85 6.39 -
Pepper Money Advantage 10.49 - - -
Pepper Money Easy 8.69 - - -
Pepper Money Essential 8.29 - - -
SBS Bank 8.49 7.19 6.49 6.49
SBS Bank Special - 6.59 5.89 5.89
SBS Construction lending for FHB - - - -
Lender Flt 1yr 2yr 3yr
SBS FirstHome Combo 5.94 5.59 - -
SBS FirstHome Combo - - - -
SBS Unwind reverse equity 9.95 - - -
TSB Bank 9.19 7.25 6.79 6.69
TSB Special 8.39 6.45 5.99 5.89
Unity 8.64 ▼6.45 ▼5.89 -
Unity First Home Buyer special - 6.20 - -
Wairarapa Building Society 8.50 6.65 5.99 -
Westpac 8.39 7.45 6.79 6.59
Westpac Choices Everyday 8.49 - - -
Westpac Offset 8.39 - - -
Lender Flt 1yr 2yr 3yr
Westpac Special - 6.85 6.19 5.99
Median 8.44 6.67 6.29 5.89

Last updated: 19 September 2024 9:31am

Previous News

MORE NEWS»

News Bites
Compare Mortgage Rates
Compare
From
To
For

To graph multiple lenders, hold down Ctrl key while clicking in list box

Also compare rates to OCR
Find a Mortgage Broker

Add your company

Use map
About Us  |  Advertise  |  Contact Us  |  Terms & Conditions  |  Privacy Policy  |  RSS Feeds  |  Letters  |  Archive  |  Toolbox  |  Disclaimer
 
Site by Web Developer and eyelovedesign.com