

Housing a good investment?
Which is a better investment residential property or a diversified portfolio of shares and bonds? WestpacTrust finds the answer to this question.
Monday, May 20th 2002, 6:01AM
House prices are on the rise again. We look at what drives these increases, how houses compare to other investment choices, and what it means for interest rates.
Requirement and Affordability
There are two key factors that affect the demand for houses – the number of people who wish to live in them, and the extent to which they can afford to buy them.
The number of people in New Zealand does not change considerably from year to year. However, small changes in the population growth rate have large effects on the demand for houses.
Population growth from natural increase averages around 30,000 people each year. The major 'swings' in population increase come from migration, who in the past have been mostly people of house-buying age.
House prices follow closely the growth of the population between ages 20 and 50, which in turn has been influenced largely by migration flows.
Migration between regions within New Zealand creates bottlenecks in demand.
Over the past 10 years the number of people in the Auckland region has swelled by 22%. As a result house prices in New Zealand's biggest city have grown at a much faster rate than the rest of the country. This reflects the relatively small set of housing that can meet the demand of purchasers.
That is, close to where they work and the services they desire. Hence, homes on good transport routes, or close to the city are in higher demand (and command higher prices) than those further from the main centres.
House price movements are far larger than the increase in demand explained by population growth. Housing demand is also affected by how much people are prepared to pay and borrow to buy a house. Therefore, income growth and interest rates will have significant bearing on house price movements. Cyclical periods of high income growth tend to increase market activity, just as when interest rates are low, house sales rise.
This is not surprising as 53% of owner-occupied houses have a mortgage on them. The home affordability index (combining wages, house prices and interest rates) shows how purchasing a house has become more attractive recently, leading to an increase in activity.
They don't grow on trees
The supply of housing is constrained by the amount of land available and its location, available resources and the ability to cater to people's tastes and wants.
To counter this, housing construction is becoming more intensive. The once-hailed quarter-acre is dying slowly amongst the rapid construction of apartment buildings, terrace housing and in-fill developments.
Prices tend to rise rapidly at the start of a housing cycle, as the stock of housing is relatively fixed. It takes some time following the increase in demand, and prices, for more housing to be available (due to the length of time it takes to build houses).
The supply of houses will generally increase when the price of existing houses is higher than the cost of building new ones. So, if demand is on the rise and existing house prices are rising, the expected capital gains from construction increase, leading to a surge in residential construction.
This market dynamic means supply comes in waves – rising demand leads to rising house prices, encourages construction, which leads to an oversupply and prices are suppressed until demand rises again.
A safe investment?
More than 60% of New Zealand's household assets are houses, and are generally perceived as a safe investment, combining a form of savings, providing a service (accommodation) and removing an expense (rent).The popular myth that house prices will always rise leads many people to make a house their major (and often only) financial investment.
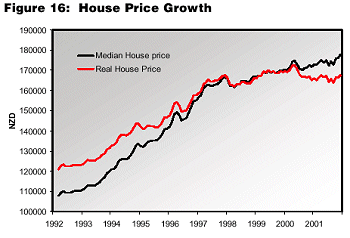
However, through the latter part of the 1990s house prices have been flat, and in real (inflation adjusted) terms, house prices have been falling of late, suggesting they are no longer a 'sure bet' store of wealth (see Figure 16).
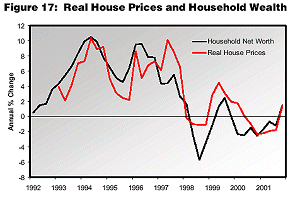
 As housing is such a large proportion of all household assets, this has had a detrimental effect on New Zealander's average wealth. In fact the WestpacTrust Household Wealth Index has been declining for around four years due mostly to declining real house prices (see figure 17).
The perceived safety of houses as an investment decision is based on the premise that house prices always rise. While this seems to have held true in the past, it is has become less certain recently.
 At present, the fundamental drivers of house prices are all in favour of further house price increases, at least for the next 12 months. migration, income and interest rates are in the house buyer's favour, but these factors are cyclical, and beyond the control of investors.
In addition, housing brings with it unique risks. An investor buys into ongoing repairs and maintenance, the relative popularity of an area, and housing style. Also, if the house is to be tenanted, the attraction and continuation of tenants presents another risk.
Against the full spectrum of investments available, the opportunity cost associated with such an investment must also be considered –including financial diversification.
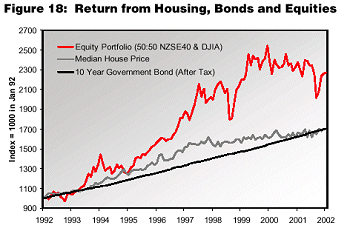
Compared to a relatively risk-free investment such as government bonds, the riskier asset of housing has not performed terribly well. Furthermore, an indicative portfolio of New Zealand and international equity investments –although more volatile – has outstripped the capital growth of the housing stock (see Figure 18).
 Hence, when making the decision to invest, people should take into account the length of time they wish to invest, the risk they are prepared to take on, what level of income they need (rent equivalent),and how financially diversified they are.
This article was written by people in WestpacTrust's Economics division.
| « OCR rises, mortgage rates may not | Long term rates drop and short ones up » |
Special Offers
Commenting is closed
|
|
Printable version |
|
Email to a friend |

