|
|
Do the fund managers know what they are doing?
Aon Consulting questions some of the reasons put forward supporting the case for international shares.
Friday, April 11th 2003, 1:50PM
The calendar year for 2002 was the worst on record for discretionary funds in New Zealand. The average return was –9.3%*
The major problem was shares.
Overseas equities gross returns *
12 Months ended 31 December 2002
Best performance -26.9%
Worst Performance -34.7%
Australasian Equities gross returns*
12 Months ended 31 December 2002
Best performance +3.9%
Worst Performance -16.0%
Given these results, anyone with a significant proportion of equities in their portfolio missed out on a positive return.
The 25.6% appreciation of the NZ$ against the US$ has been one of the major factors that has affected returns for these portfolios. The MSCI Gross return for the calendar year 2002, for a portfolio that was unhedged was –35.9%, compared with -23.8% for a fully hedged portfolio.
The above manager returns include the impact of any currency hedging they had in place over the year in both Overseas Equities (in which the average manager is about 50% hedged) and the Australian component of Australasian Equities (where managers can have hedging from 0% to 100%).
(*Source the Aon Investment update for December 2002)
What are the fund managers currently predicting?
According to the fund managers there are still several reasons for buying equities. These are set out below, followed by some reasons why we think that they don’t stack up.
Reason 1. The Historical Bear Market argument.
We are in the worst bear market since the depression.
The following table shows the previous bear market events:
Notable Bear Markets Since 1929
|
|
Dates
|
Number of Months
|
%Peak To Trough Decline
|
Months to Break Even
|
|
Aug 1929-Jun 1932
|
34
|
(69.5)
|
52
|
|
Mar 1937-Mar 1938
|
12
|
(29.3)
|
24
|
|
Feb 1962-Oct 1962
|
8
|
(15)
|
6
|
|
Dec 1969-Jun 1970
|
6
|
(17.8)
|
7
|
|
Dec 1972-Sep 1974
|
21
|
(43)
|
46
|
|
Aug 1987-Dec 1987
|
4
|
(23.5)
|
13
|
|
Dec 1989-Sep 1990
|
9
|
(28.9)
|
35
|
|
|
|
|
|
|
Mar 2000-Sept 2002
|
30
|
(44.0) so far
|
???
|
|
|
|
|
|
|
Source: Global Financial Data, MSCI and
Bernstein. Thanks to Alliance Capital
for information.
|
Fund managers use the above table to argue that, historically the decline can’t last much longer because it never has before. You should therefore expect an upturn and continue to invest in equities.
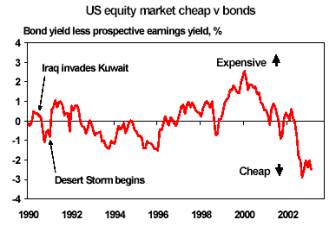
Reason 2. The Bond Yield to Equity Yield comparison
Another argument fund managers use to support continued investment in equities is that the difference between the bond yield and the expected earnings yield on equities is as large as it has been for a long time. This means that equities may be undervalued relative to bonds.
Reason 3. The GDP Growth Argument
Some analysts have expectations of 3% real growth in GDP in 2003 in the US. This is used by fund managers to argue that steady GDP growth will lead to better returns, justifying investment in equities.
GDP Forecast for the World Economy
|
|
% Change in real
GDP-
|
|
|
2001
|
2002
|
2003
|
|
United States
|
0.3
|
2.4
|
2.5
|
|
Western Europe
|
1.6
|
1.0
|
1.7
|
|
Japan
|
-0.3
|
-0.1
|
1.2
|
|
China
|
7.3
|
7.9
|
7.5
|
|
Other East Asia
|
1.9
|
4.2
|
4.6
|
|
Latin America
|
0.5
|
-0.8
|
2.5
|
|
World
|
2.1
|
2.7
|
3.3
|
|
IMF forecast
|
|
2.8
|
3.7
|
|
Source: Economics@ANZ;IMF World Economic Outlook
Oct 2002 –Thanks to ING for supplying.
|
Any or all of the above arguments may be used by fund managers to support their view that there are bargains to be had by investing in equities.
So what does Aon think?
1. The Historical Bear Market argument.
The argument why we are about to come out of the decline in equities goes like this.
Never since the Great Depression have we seen this number of months of decline. The peak to trough decline is the second highest in history. Given how much worse it was in the depression, and the amount of monetary and fiscal stimulus introduced by world wide Governments, we must be close to returning to the break-even point.
The argument that statistics can show anything is probably very valid here. The depression was a lot worse in respect of unemployment and economic failure of businesses. . So the mere fact that there is a decline in economies that are undergoing so much stimulus means that some fundamentals have changed. We all remember the tech bubble and the high P/E (price to earnings) ratios that went with that period. Although to some degree investors are driven by sentiment and not fundamental returns, the extent to which sentiment or mood determines market values is much greater than modern economists, brokers, fund managers and theorists would have us believe. The number of months required to reach the “break even” figure in every cycle really shows the time that it took for investor confidence to return. Economics is not an exact science and until we see a return of investor confidence in the “modern” market arena the equity markets will not rise sustainably.
The late 1990’s bubble was the biggest credit bubble for over 100 years, possibly of all time due to globalisation, driven by debt and paper wealth when savings and capital formation were terrible. Profits were distorted by financial chicanery. The economy of the 1930s or any other time is irrelevant in predicting when markets will recover. Perhaps Japan is showing the way with 12 years since the peak and it still has not bottomed! We hope not, but it is a salutary lesson.
2. The Bond Yield to Equity Yield comparison
The argument here states that because bond yields are so low and the gap between equity yields and bond yields so large, that this is a great time to buy and acquire equities at the bottom of the market ready for the inevitable rise.
We clearly remember six months ago one manager telling us that they had gone overweight in Overseas Equities based on this comparison. Well, guess what? The market continued to decline.
Now hindsight is a wonderful thing and we at least give them credit for backing a viewpoint and using their ranges when other managers haven’t. However, clients and their members have paid for that view.
More importantly we need to ask two questions:
1) Are we certain about future corporate earnings?
2) How do the current P/E ratios line up with historical highs and lows?
In respect of future company earnings, we see that as a major issue, particularly in the US. Wealth is generated by capital investment in plant, new buildings and equipment, creating demand, employment, income and profits. Profits are required to pay down the massive debts that were accumulated in the bubble to finance mergers, acquisitions and share buy-backs, none of which added to productive capacity. Other claimants on profits are spiralling health care costs, pension fund top-ups, the list is long, all of which get their share before shareholders.
There is also the not-much-talked-about impact of people being retrenched and business spending being cutback. Every such cut impacts other companies in that their income is made smaller by the decision of the other to make the cut. This spiral is not easy to get out of. Also there is no pricing power as inflation is very low and so companies cannot raise prices to restore the balance sheets.
The following chart shows that price as a ratio of earnings is still relatively high. When compared with other low points in the last 20 years, we still have a significant level of potential fall in the markets. The ratios of price to assets and price to dividends show a similar picture.
|
Major World
Markets As at January 2003
|
Price/Earnings
|
Current
|
20 Year Low
|
20 Year High
|
|
United States
|
21.8
|
9.1
|
34.6
|
|
MSCI World Index
|
22.6
|
10.9
|
35.7
|
|
|
|
Source
Capital International Monthly Global report for January 2003
|
If we all expected future earnings to be much higher than current earnings, this could explain the current P/E ratios.
General consensus of opinion is that significant growth in corporate earnings is not expected. Some companies no doubt will perform well and have P/E ratios that are justified. As a general rule however they still seem on the high side.
In all previous equity market falls that have occurred following a sharp rise and the depression that follows, the market s have bottomed at P/Es below the long term trend of about 16. Mean reversion to this 16 level is the key. A survey of over 1500 investment professionals recently suggested that over 90% of them felt that the (US) market would dip below the long-term P/E mean of 16 within 10 years. That is a long way down from current levels and destroys their credence in talking up the market!
3. The GDP Growth Argument
The argument here states that GDP growth predictions for 2003 are higher than 2001 and 2002. Throw in the amount of monetary stimulus being created by central banks around the world along with the fiscal stimulus in the US and clearly there must be an upward movement in the equity market.
Real growth depends of course on the level of inflation as well as the underlying growth. Some commentators have argued inflation will be much higher than expected suppressing real growth.
Also let us look at the 2002 December quarter in the US.
Fourth quarter GDP grew at 0.7 %p.a. annualized. Unemployment remained at 6%. Of more concern was the fact that GDP grew through Government expenditure by 0.8%, meaning GDP growth in the rest of the market actually went backwards. There are some mixed signals from the US with the Purchasing Managers Index rising from 50.2% to 55.20% and continued growth in the non-manufacturing Industry.
However, regardless of that, GDP growth is not massive. It is modest. We really need a buoyant economy worldwide to overcome the negative market sentiment. The US appears to be the country whose leadership is required to recover and grow, but this is looking increasingly unlikely. Time and consistency are what is needed before earnings are recognized as sustainable and these flow through into increasing share prices.
With the amount of economic stimulus we would perhaps expect growth. However the bad accounting issues and the failures of Enron and others means a more conservative approach by investors. A track record needs to be reestablished before that all-important confidence returns. The GDP growth, what ever it ends up being, must be sustainable and of a reasonable size before it impacts on the equity markets.
Investors will look at real returns, dividend policies and consistency. Microsoft for the first time in history has paid a dividend. This trend will likely be extended to other companies, which need to show a real return to shareholders.
There is no direct relationship between what happens to an economy and the performance of a sharemarket. Sharemarkets are priced based on myriad investors perceptions of the future. Sentiment and confidence play a very large part, valuations only a little.
So what will happen to the equity markets?
The expectation from fund managers that returns are about to change for the better is understandable. They are performing badly in equities compared with fixed interest returns. The argument that equities will not always produce positive returns but overall will do better than fixed interest seems to lose its appeal now that the longer term (three year) returns are also negative. Other comments such as “we are performing to benchmark” or “we have performed better than other managers” are possibly true, but have not helped managers retain their credibility.
Also, “this is a long term investment” loses its strength for those who are saving for retirement and are close to retirement. It is worse still for those in retirement who don’t have any other earnings to make up the falls of the last three years.
If you are a passive manager you have an excuse of a falling market. As an active manager you don’t. Now is the time for fund managers to prove what they can do by selecting the right stocks that will provide positive returns.
Every investor reading this, and seeing the data will need to draw their own conclusions. Like you we do not have a crystal ball but we offer our view.
Because of the high P/E ratios, worldwide reliance on the US economy, and current low levels of investor confidence, we see an equity market that tends to be flat to falling as opposed to flat to rising over the next 12 months and possibly beyond. Over a 5 to 10-year term we do see it more than likely that not that returns in overseas equities will perhaps be around 9%pa gross on average, but certainly not in the immediate future.
In saying this, we are not predicting what equity markets will do, as we have no idea. On the one hand, equity markets could rally sustainably if solutions were found to some or many of the problem. However, the evidence we have seen leads us to conclude that it will not be an easy time for equity markets with the difficult economic factors exaggerated by geo-political tensions and high oil/energy prices and that uncertainty could last longer than many are suggesting.
Equity markets will eventually rise but trustees and individuals should be comfortable with their risk levels in the meantime.
Commenting is closed

|
|
Good Returns Investment Centre is brought to you by:
Subscribe Now
Keep up to date with the latest investment news
Subscribe to our newsletter today
Edison Investment Research

© 2026 Edison Investment Research.
View more research papers »
Today's Best Bank Rates
| Heartland Bank |
6.30 |
|
| Rabobank |
6.30 |
|
Based on a $50,000 deposit
More Rates » |
| Heartland Bank |
6.10 |
|
| Rabobank |
6.10 |
|
Based on a $50,000 deposit
More Rates » |
|
|
|

