

Market Review: June 2009 Commentary
Equity markets have rallied over recent weeks, despite the mixed performance of economies around the world. In New Zealand, the rally has been significant, accompanied by a strengthening New Zealand dollar. The latter is an unwelcome ingredient for our economy. In this month's Tyndall Comment, Peter Lynn discusses the New Zealand rally and probability of whether we have seen the bottom of the market yet. He also explains why the NZD rise is not sustainable.
Tuesday, June 9th 2009, 9:36AM
The Rally Continues
As May ended, the sharemarkets completed their third consecutive positive month in a row. Since March 3, the NZX 50 Index is up 17.5% to the end of the past month. There hasn't been a three month rally (using full calendar months) of this magnitude since the three months ended January 1999 - over 10 years ago!
The same thing has happened on the global stage, although on an even bigger scale. The MSCI World Index (in local currency terms) is up 34.2% from its March 9 bottom to the end of May. There hasn't been a three month period of this magnitude (either positive or negative) in the 40-year history of this index.
Unfortunately for New Zealand investors in global equities, unless you were hedged, you have not reaped the full benefits (or even many of the benefits) of this large global rise, as the NZD has risen in concert. The NZD has been the strongest currency in the world over the past three months, rising against every one of the 16 other most traded currencies over that period.
The biggest rise has been against the weak USD, where the NZD fell to USD 0.4927 on March 2, but then rallied strongly to USD 0.6405 on May 31, or a 30% rise.
To put this NZD rise into perspective, compare the local currency MSCI World Index return of 34.2% quoted above (from March 9 to May 31), with the NZD unhedged MSCI World Index return over that same period. It was only 10.3% -- still good, but significantly reduced by the currency effect.
This NZD rise is not sustainable. Since the end of May, the NZD has continued to push up to close to USD 0.6600, which is the same level it was at in September 2008, before the OCR cuts saw it plummet away into the 0.5000's. It is, again, causing significant angst for exporters and is certainly not what the RBNZ wants.
Dairy farmers, already seeing a much reduced 2009 payout are getting a double whammy as the relatively high NZD further reduces the NZD value of their milk production. There could well be further falls in this payout level, which, as the media has pointed out, has sizeable effects on the whole New Zealand economy. I expect the NZD to fall away from these high levels.
If it doesn't, the RBNZ could well intervene to force it down. In a global game of having reduced currencies, New Zealand is the biggest loser so far, despite making tremendous strides over the previous six months.
Turning back to the New Zealand sharemarket, it is interesting to see if this pattern of a large rise immediately following a large fall is par for the course.
Although we all know that what happened in the past almost never recurs exactly the same in the future and is, at best, only a weak guide to future patterns, looking at past New Zealand sharemarket shocks of a similar magnitude to those suffered in the current economic environment may help us better understand what the future could hold. At the very least, it provides a perspective.
Below is a table showing the five largest "drawdown" periods for the New Zealand sharemarket from my data (which goes back to 1931). A drawdown is the period from the top to the bottom of a cycle.
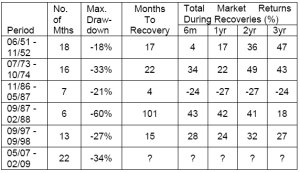
The "Months to Recovery" column represents the number of months it took to regain all losses. The total recovery returns for two and three years are unannualised, cumulative returns. All data is based on full calendar months.
There are several interesting features of this table, including the following:
· New Zealand has not really had a lot of crashes in the nearly 80 years of history;
· The majority of the crashes have occurred in the past 25 years;
· Unlike the rest of the world, we never had a crash during the early part of this decade (the bursting of the tech bubble), which had global drawdowns of nearly the same magnitude (or, in Europe's case, even more) than the 07-09 financial crisis;
· The 1987 Market Crash was short, massive and took ages to recover from; contrast the New Zealand results with what happened in the US - drawdown of -29% and only 19 months to recover those losses;
· On average, each drawdown prior to the 07-09 Financial Crisis lasted approximately 16 months (which is actually pretty similar to global drawdowns' lengths) and the average maximum drawdown was 32% (again almost the same as global averages);
· If we assume that the 07-09 Financial Crisis did conclude in February 09 (or early March), then it was, for New Zealand, a quite a bit longer drawdown than average (in fact, the longest large drawdown experienced) and was very close to the average drawdown magnitude (although that average was distorted by the
-60% during the 1987 market crash;
· The New Zealand experience during the 07-09 Financial Crisis is of a drawdown that lasted longer than other countries around the world, but was of a significantly lower size (most global markets fell 50-60% over the crisis' usual length of mid-late 07 to Feb 09)
The "Months To Recovery" column shows that there is no real pattern to how long it takes to recover from a major crash, although there is broadly an understandable correlation between the size of the drawdown and the time to recover (although the length of the drawdown seems to have little bearing on that time to recovery).
Finally, it is also interesting to observe the patterns of returns during the recoveries, although we have to ignore the recovery from the 86-87 "mini-crash", as it was followed four months later by New Zealand's largest ever market shock. The 51-52 fall is isolated both chronologically from the other crashes, as well as by its recovery pattern. Observing the final four columns for that early ‘50s market fall tends to suggest that recovery was a very steady, positive return.
The other crashes, though, earned the majority of their recovery in the six months following the bottom of the crash. This is an interesting result, because it means that if you had exited (or significantly reduced) your exposure to a market after it had fallen significantly, you had a very limited window in which to get back in to try to recover your losses. In other words, if things are getting very bad and you are still exposed, hang in there, because the rebound is likely to be short and sharp.
Of course, we have no idea whether this will apply to the 07-09 Financial Crisis. Did we hit the bottom in those early days of March? Have we seen a similar pattern of a very quick and large bounce back? Or have the past three months been a bear market rally that will ultimately lead to a new low either later this year or early next.
While there have been much talked-about "green shoots of recovery" evident in some economic data, unemployment is still rising and there is still a lot of uncertainty out there on a wide range of issues, from complete recognition of global banks' bad assets to the global automobile industry to whether all of the fiscal stimuli provided by the various governments will indeed be sufficient to reestablish growth in economies. Among the green shoots of recovery, we are still seeing a few yellow weeds.
I do not believe we will comfortably be able to say that the markets have bottomed (whether than bottom has already occurred or is yet to occur) until next year at least.
Peter Lynn, CFA
Head of Strategy
| « Market Review: June 2009 London Commentary | Market Review: July 2009 London Commentary » |
Special Offers
Commenting is closed
|
|
Printable version |
|
Email to a friend |

