

Market Review: October 2009 Commentary
This month Tyndall's Peter Lynn comments on the unprecedented rise in the New Zealand Dollar. "All countries want the lowest currency." Our currency is hurting our exporters and prospects for recovery in our 'real' economy.
Friday, October 9th 2009, 9:54AM
The Rise of the New Zealand Dollar and Hedging
With the very cheap airfares on offer, it seems a great time to be contemplating an overseas holiday at the moment. That is, of course, assuming that you still have enough money left over from the recession and your job is relatively secure (assuming you still have a job, that is).
As 2009 has progressed, it has become more and more affordable to travel to the US or Japan, as the New Zealand dollar (NZD) has embarked on a recovery of unprecedented proportions against the greenback (USD) and the yen. In fact, in the past seven months, the NZD has moved from USD 0.5008 at the end of February to USD 0.7234 at the end of September (it temporarily hit USD 0.7300 at around midday on 23 September).
This movement is a 44.4% rise in the value of the NZD relative to the USD. Since the March 1985 float, the largest previous seven-month rise in the NZD/USD rate had been 19.3% (in the period to April 2003). So this latest rise has been more than twice as strong as any historical rise in such a time period.
It is a similar story for the Japanese yen, with a 32.2% rise over the past seven months (it was closer to 40% for the seven months ended August). The previous biggest rise over such a period for the yen was only 20.5%. Note that, in contrast, the NZD is only up 4.6% against the Aussie dollar over the same period, as the AUD has climbed 38.1% against the USD.
One of the main reasons for this strength in the Australasian currencies is the re-emergence of the carry trade as risk appetites have increased after the early March lows. When short-term Interest rates are close to 0% in the US, Japan and Europe, it is little surprise that obtaining higher yields in the currencies of the stable economies of Australia and New Zealand will take place. Speculation that these two countries (especially the former) will be the first developed countries to raise interest rates only encourages capital inflows to them. The result is that, as always, it is supply and demand driving the NZD direction and, unfortunately, the NZD (and the New Zealand economy) is at the mercy of these capital flows.
For example, there is a belief that the Indian Central Bank has been a significant purchaser of the NZD. Protests from the RBNZ that the NZD is at too high a level have little impact against the might and resources of the Indian Central Bank.
The RBNZ though, is not the only central bank desiring a low local currency - they all are. In the current environment, with fiscal stimuli all used up, still rising unemployment, very slow recovery in the consumer sector and almost-zero interest rates in the developed world, a weaker currency may be the only policy option left for central banks to help their economies recover. The problem is that currency movements are a zero-sum game - a rise in one currency is offset by a fall in another.
Although all countries want the lowest currency, they can't all have it.
The capital flows that result from these movements cause a significant amount of volatility for the NZD. If you look at the annual standard deviation of spot rate movements (against the USD) for all of the most traded currencies in the world, over the last year they have all generally been around the 15-20% level. However, the AUD volatility is at 27.8% and the NZD is at 30.5%, which highlights how these smaller currencies are more subject to the whims of global capital movements.
We all know the NZD is high at the moment, but what everyone wants to know is where it is going next. Investment market forecasts are notoriously inaccurate and currency forecasting is the most difficult. In my 16 years in this industry I have witnessed several currency managers ruin a couple of years of positive currency gains with a single quarter when the currency markets moved sharply against them. So trying to predict the NZD's direction is an exercise fraught with danger.
Keeping that in mind, though, we often need to establish how much currency hedging to apply to portfolios. We tend to apply a currency hedge only to the global equities portion of funds (on the rationale that global bonds and other asset classes follow a more stable underlying return profile that we do not want to jeopardise with volatile currency exposures). Unless a "set and forget" policy is required (that is, never change the hedge ratio), some expectation of the likely future direction of the NZD helps determine this ratio.
Since its float on 4 March 1985, the NZD has historically moved in a cyclical fashion. Although, as the following chart of the NZD:USD rate shows, the frequency and amplitude of these cycles have not exactly established any sort of pattern yet (there have really only been three cycles since the float and the last one is quite distorted).
I have also plotted some statistics on the chart. A long time ago I was taught that one way of possibly predicting currency direction was to judge how far the level of the NZD relative to the USD was from its mean level. When it gets to two standard deviations away from the mean level it is supposedly due for a turnaround.
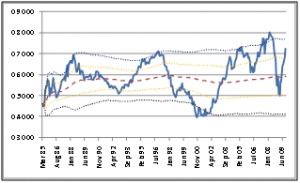
The mean (or average) level of the NZD has tended to be just under USD 0.6000. The two dotted orange lines represent one standard deviation above and below this mean (around USD 0.6500 and USD 0.5000, respectively. The two outside dotted lines are two standard deviations away from the mean. Note that the standard deviations are increasing in size as time has gone on.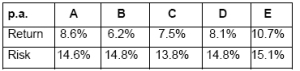
The following table looks at returns since 1 January 1988 (which is as far back as I have hedged data) earned on the MSCI World Index if various hedge ratios were applied. I have used the MSCI World Index returns as the hedged return includes
the hedging premium based on interest rate differentials between New Zealand and the US.
Key to hedging strategies:
A. 100% hedging at all times
B. no hedging ever
C. 50% hedge ratio at all times
D. No hedging whenever 2 s.d. more than the mean is reached, switch to 100% hedging when 2 s.d. less than mean is reached
E. No hedging whenever 2 s.d. more than the mean is reached, switch to 100% hedging when 1 s.d. less than the mean is reached
Over this 20+ year period from the start of 1988 (when the NZD was USD 0.6585), there has been a benefit to hedging that is mainly attributable to the quite significant hedge premia available (note that these premia are now relatively insignificant after the yield curves have shifted from an inverted to a normal shaped curve and New Zealand short term interest rates have reduced substantially). The stability of these premia has also contributed to a lower risk level.
Maintaining a 50%:50% hedge ratio reduces the risk significantly, with the return expectedly in-between the hedged and unhedged returns. It does, though, get more interesting when one starts using the standard deviation levels as switching points.
Using two standard deviations as a turning point is not as effective as being fully hedged, as the currency level has only fallen south of two standard deviations below the mean for one period in the past 20 years. However, an interesting increase in return is achieved if one uses only one standard deviation below the mean as a point to start hedging again in conjunction with the upper two standard deviation level to take it off (strategy E in the table). I have looked at other strategies involving, for example, moving to 50% levels as you pass through the one standard deviation level, but none of them would have worked as well as strategy E above. No doubt someone smarter than me has devised an even better strategy than this.
There are some issues here, though. One is that there are other currencies than the USD, of course, and their patterns may be different, so just using the USD may also be suboptimal. Another major point is that this is all backwards-looking and, as we all know, the past is no guide to the future. For example, if you followed strategy E above, you would have fully hedged at the end of February and be now enjoying the sharp increase in the NZD since then. If though, the Indian Central Bank decided to suddenly withdraw its NZD investment, or risk appetites changed suddenly, then the NZD could well fall sharply from here. You would be fully hedged while the NZD falls all of the way to one standard deviation below the mean (currently a level of USD 0.5027. As a result, one may need more flexible strategies than the above and take consideration of future expectations for currency movements, economic conditions and interest rates.
The RBNZ certainly are not happy with the continued strength of the NZD. A high currency does not help our exporters lead our economic recovery. If it remains persistently high, there remains the possibility that the RBNZ could intervene in the currency markets, as it did in mid-2007 (represented by a short, sharp blip in the earlier chart). As can be seen, though, that did not have much effect as the currency soon went higher than it had ever been post-float.
It is a difficult and risky enterprise trying to predict currency movements. Those who are successful over long periods are few and far between.
Peter Lynn, CFA
Head of Strategy
| « Market Review: October 2009 London Commentary | Consumer Survey: Cotton says reforms already underway » |
Special Offers
Commenting is closed
|
|
Printable version |
|
Email to a friend |

