Pathfinder Commentary: Portfolio protection
A criticism of index funds and “buy and hold” portfolio strategies is that they rise and fall with the market.
Monday, February 4th 2013, 11:45AM
by Pathfinder Asset Management
This leaves these portfolios fully exposed to market downturns. There are, however, a number of ways active and passive portfolios can protect against market falls. This note explains some approaches to equity portfolio protection – and considers the benefits and costs (both explicit and implicit) for each.
Beta basics
First, some market basics for understanding protection strategies. The measure by which a portfolio’s value rises or falls as the market rises or falls is called “beta”. Beta is a measure of how correlated the portfolio is relative to the market (do they move in the same or different directions?) and the size of the move relative to the market (does the portfolio move by more or less than the market?).
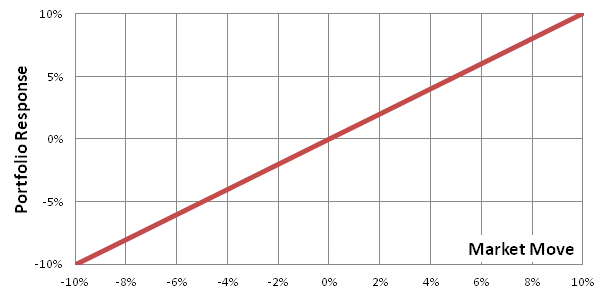
Positive beta implies that the portfolio and market move in the same direction. For instance, a beta of 1 would suggest there is no difference between moves by the portfolio and the wider market. Negative beta is the converse – the portfolio tends to fall as the market rises, and rises as the market falls. A high beta (>1 or <-1) implies that the portfolio moves by more than the wider market. And to complete the confusion, zero beta means there is no relationship between market and portfolio moves. The beta for portfolio movements compared to the market is represented below:

Beta is a useful measure, but can only be accurately calculated with hindsight. Future estimates of beta are just that – estimates. Beta can (and does) change over time.
Below is a chart of portfolio returns (vertical axis) plotted against market changes (horizontal axis). This is intended to represent a beta of “1” – i.e. the portfolio experiences a 5% return when the market rises by 5%. Equally the portfolio suffers a 5% loss if the market falls by 5%. This is the intention of many index trackers – the portfolio tracks exactly returns of the wider market (less fees).

The dream beta relationship
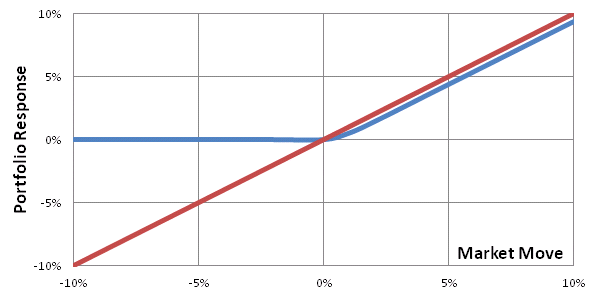
The dream portfolio beta is not a straight line, but has a more “asymmetric” shape. The portfolio takes the gains of the market but does not suffer the losses. An example is shown below. On the right hand side of the chart the portfolio (blue line) rises as the market (red line) rises but on the left hand side the portfolio has limited losses as the market falls. If only real world investing was this simple!

Sadly, fund managers cannot systematically and consistently recreate this dream portfolio beta in reality. There are no free lunches in markets - if a portfolio manager “buys” downside protection there will be a cost. If the market falls – then the cost looks cheap and the manager looks smart. But if the market rallies instead, then returns will be lower. A homeowner buying fire insurance has the same experience. If the house does not burn down, then the insurance premium is a direct cost. If the house does burn down, then thank goodness for the insurance.
There are many tools and strategies which allow investors and fund managers to alter the shape of the beta curve. We look at several below.
Cash is king (except in a rising market)
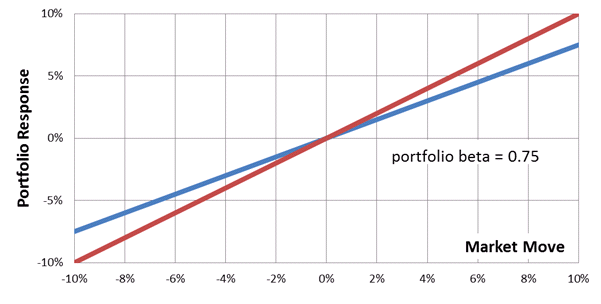
The simplest protection is for the portfolio to go to cash. This is a rather blunt instrument – it changes the slope but not the shape of the beta curve. This is represented in the chart below with portfolio returns in blue and market returns in red. Portfolio beta remains both linear and symmetric with lower losses in falling markets (left hand side of chart) but also lower gains in rising markets (right hand side of chart). For instance, by going to 25% cash the investor can successfully reduce a 10% market fall to a 7.5% loss, but if the market rises 10% the portfolio return is limited to 7.5%.

This approach to downside protection can only succeed if the manager or adviser is skilled at market timing – research from the US and Europe would say this is difficult to achieve consistently year after year. Investors often prefer the use of cash for protection not just for its simplicity but because there is no apparent cost. However there is an implicit cost. By going to cash an investor foregoes potential upside – while not an explicit cost it is an opportunity cost and must be recognised.
Defensive stocks
A similar change to the linear beta slope (again not a change to shape) can be achieved by using low beta stocks in a portfolio. Sectors such as utilities, high dividend stocks, healthcare, REITs and consumer staples are typical examples of stocks or sectors with low beta. They typically don’t fall as much in a weak market, but also often don’t return as much in a rising market.
Changing the slope of the curve (and not shape) can be helpful depending on your world view. A more sophisticated strategy is to change the shape of the beta curve from a linear relationship to some form of more asymmetric curve (more like the “dream portfolio beta” chart). Can this be done?
Equity options
The use of options can create this outcome – but it comes with a cost. Buying put options on a broad market index like the S&P500 has a premium cost – if the protection is not needed this cost will be amortised over the option period. But the outcome is not symmetrical. In a rising market, the portfolio return will be lower by the cost of the option. But in a falling market, losses are limited. – The worst case loss is known ahead of time.
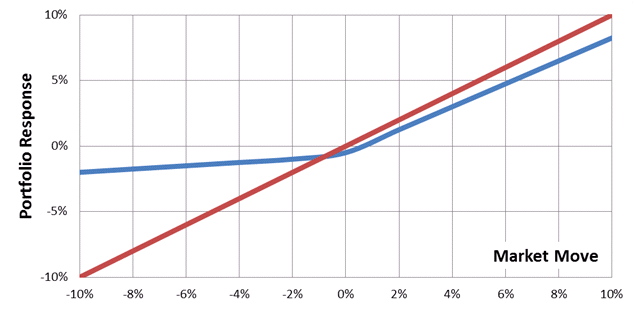
So there is a cost to an option strategy, usually seen as a small underperformance in a rising or stable market – but an asymmetrically larger saving in a falling market. The use of options can change the shape (rather than just the slope) of the curve. This gives us return scenarios that resemble our dream portfolio beta chart. The chart below illustrates the impact of buying put option protection for a theoretical global equity portfolio (in blue) against the market return (in red). Note the small underperformance in a rising market but the much larger outperformance in a falling market.

Conclusions on portfolio protection
So what does this mean in practice? Here are a few key thoughts:
1. Think about all forms of protection. Whether a portfolio is active or passive, the use of portfolio protection should at least be considered. There is no silver bullet for protecting capital – but be sure to challenge your thinking.
2. Using cash and defensives to protect portfolios. Cash and low beta defensive stocks in a portfolio can be useful. However unless it is implemented with very high conviction (i.e. you believe you can successfully time your entry into the market) the linear upside / downside payoff may not help the portfolio.
3. Option protection has a desirable pay off. Options can be a desirable tool for fund managers and skilled investors. Options can provide an “asymmetric” (non-linear) payoff and the cost of option protection is very obvious (because buying options has an explicit up-front cost). It is essential, but not always intuitive, to compare the option cost to the implicit costs of holding cash or low beta stocks. (Note: there are more complex option solutions than just buying puts, but no strategy is a free lunch).
4. Understand how protection impacts on returns. If a portfolio underperforms a rising market don’t immediately shoot the manager. Ask questions about why the portfolio underperformed. Was it simply from the manager’s fee burden? Was the under-performance from the cost drag of buying options for portfolio protection? Protection can provide a less volatile return profile – but it will often come with a cost.
5. Protecting capital is far more important to long term portfolio returns than capturing an extra 1% or 2% return in a rising market. A strong bear market can cause severe damage to portfolio values. If your portfolio falls 50% in a bear market, you now need a 100% return to get back where you started! Don’t underestimate the need to constantly review – and possibly implement – strategies for portfolio protection.
John Berry
Executive Director
Pathfinder Asset Management Limited
Pathfinder is an independent boutique fund manager based in Auckland. We value transparency, social responsibility and aligning interests with our investors. We are also advocates of reducing the complexity of investment products for NZ investors. www.pfam.co.nz
| « Emerging markets show long-term gain | Hamish Douglass Unplugged - Latest Video from Adviser Briefing - August 2012 » |
Special Offers
Commenting is closed
| Printable version | Email to a friend |


