

Portfolio insurance protection explained
Castle Point Funds Management says there are heightened risks in financial markets and it's time for managers to put some protection into their portfolios. This feature explains how they are they are adding protection.
Tuesday, October 23rd 2018, 8:00AM
by Castle Point Funds Management

Nassim Taleb's definition of a "Black Swan" is a risk event that is wholly unpredictable and immeasurable. For example, “A Black Swan is not dying because your parachute didn't open while skydiving... it is dying because the guy whose parachute didn't open landed on you while you were golfing.”
Selling insurance is generally a profitable business. By charging a large number of customers a relatively small amount an insurer can diversify its risk enough to be able to afford to pay out on the occasional claim.
By understanding the risks, and charging appropriately, an insurer can further increase its profits.
So, one would hope, life insurance for a habitual sky diver is considerably more expensive than it is for a golfer.
Several studies have found that a similar dynamic is true in the financial markets. In the long run, there are profits to be made by selling financial instruments with both lottery and insurance characteristics (see https://www.cfapubs.org/doi/pdf/10.2469/faj.v68.n5.7 and https://www.cfapubs.org/doi/pdf/10.2469/faj.v67.n3.7).
This is because investors struggle to quantify risk and reward at the far left and right tails of return distributions, and typically pay too much for lottery tickets (right tail events), and for insurance against excessive loss (left tail events).
The team at Castle Point try hard not to behave in a naïve manner. We should therefore be in the business of selling insurance, not buying it.
However, we currently believe that as global share markets continue to reach highs, despite numerous risks on the horizon, it is prudent to consider some form of portfolio insurance.
To tailor our potential insurance to fit such an event we need to consider several factors:
- It needs to be cheap. We hope we don’t need to ‘claim’, and if we do it might be years in the future, so we need to be able to afford to pay the ‘premiums’ for some time.
- We can afford to accommodate some losses, ie we can carry a reasonable ‘excess’.
- If our ‘policy’ does pay out, it needs to be for a considerable amount. Not so much that our funds profit from a market crash, but enough to reduce possible losses to a bearable amount.
- If we do need to ‘claim’ we need to be certain our ‘insurer’ will still be in business to pay us, especially since capital markets are likely to be in some turmoil at the time.
Currently, our favoured form of portfolio insurance is a bundle of exchange traded put options, where we purchase the right to sell either individual securities, or the index, at a fixed price (below current levels) for up to 3 years into the future.
We mitigate potential counterparty risk (our ‘insurer’) by using exchange traded instruments held directly with ASX Clear rather than through intermingled accounts with intermediaries.
Option terminology can get complicated, and involve a language known as Greeks, but we’re going to attempt to keep things simple. A common method of valuing the price of ‘insurance’ is the VIX Index, which is expressed in terms of implied volatility.
The higher the implied, or expected, volatility, the higher the price.
The VIX measures the implied volatility of a weighted basket of options with between 23 and 37 days to expiry that have the S&P500 as the underlying asset and interpolates this to give a 30-day estimate.
The CBOE VIX, based on the S&P500, has been calculated in its current form since 2003 whilst the ASX VIX, based on the Australian S&P200 Index, has been calculated since January 2008.
That the VIX, and the Australian VIX, is lower now than it was around the GFC is unlikely to be news to many:
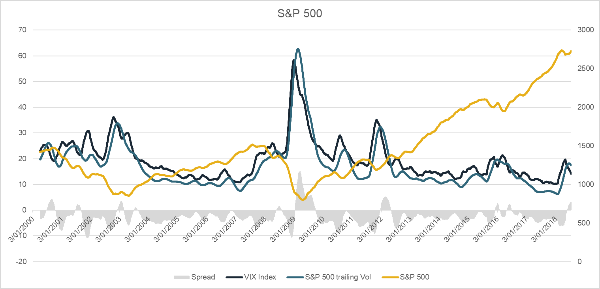
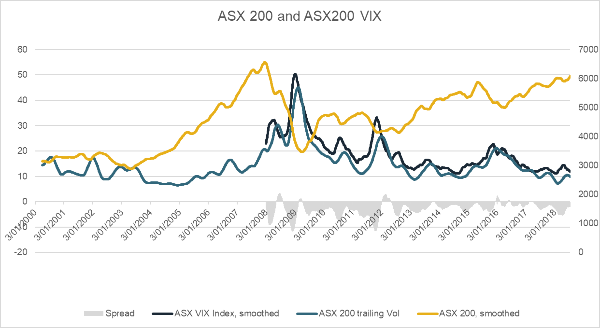
The above charts highlight the negative correlation between the index return and the VIX, and show how the VIX, the level of expected volatility, closely tracks the level of actual volatility experienced.
The grey bars show the spread between the two. That this is often negative is lauded as one of the reasons why selling ‘insurance’ via options is profitable.
Both VIX indices are based on the price of options with just 30 days to expiry, so whilst they are the focus of most of the market, they are of little interest to a long-term investor such as us.
The VIX calculations also take an average across all traded options, both puts and calls, regardless of how near or far the exercise price of the option is to the price of the index.
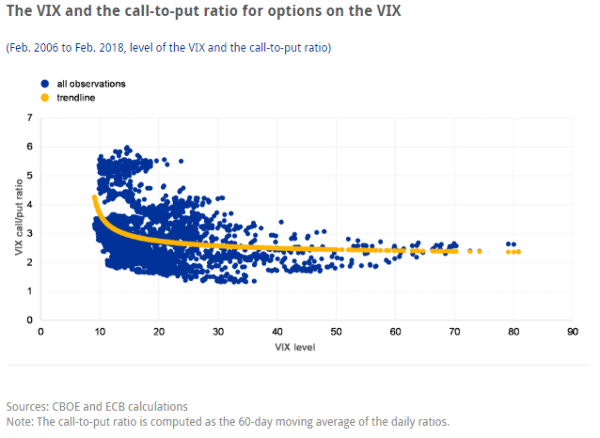
Analysis by the European Central Bank shows that during periods of low volatility option trading is dominated by calls, and it is only as volatility increases that the proportion of puts traded increases. To us, this indicates many participants are speculating, and a significant proportion of investors are only buying their ‘insurance’ when it is at its most expensive.
This is the equivalent to the sky diver phoning his insurance company once he’s out of the plane and experiencing problems with his parachute and unlikely to result in cost effective insurance.
If an observer is looking for a single number to indicate the level of volatility the entire market is expecting, the VIX is a good start. As an indicator of the cost of insurance, there are better measures, but they are not readily accessible, and they depend on the type of insurance.
As indicated above, we are interested in long dated insurance, and we’re prepared to accept a higher excess in return for lower premiums, or in the language of options, we want far dated, and far out-of-the-money puts.
There is no Index price series for these options like there is with the VIX or the ASX VIX, and it didn’t take a lot of analysis to establish why. They are seldom traded in significant quantities, and they do not appear to trade in an efficient manner.
The below chart shows actual sales and purchases of long dated put options. Every trade with a quantity greater than 50 is represented by a dot.
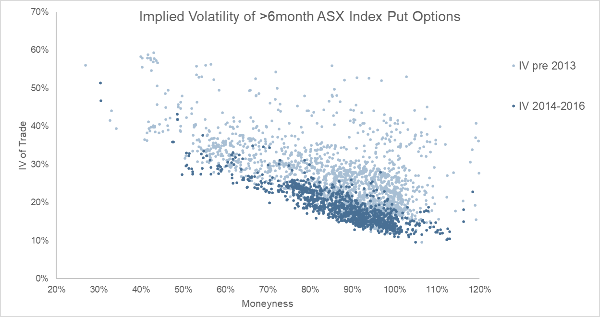
The top left to bottom right slope in the above chart is known as the volatility smile, and reverses to become upwards sloping to the right if far out-of-the-money call options are included.
The pre-2013 trades include the GFC period.
As more recent trades are included, 2014-2016, we can see the dispersion, and the trade volume, decreasing.
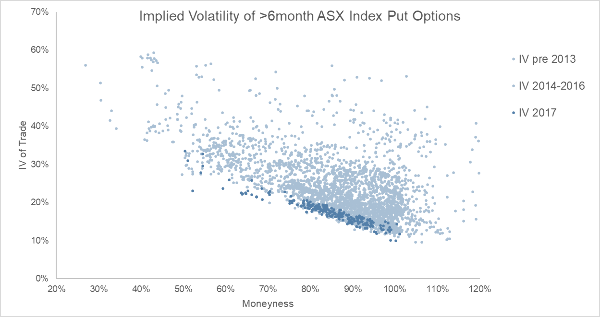
Moneyness refers to the exercise price, or strike price, of the option. A 50% moneyness put option is the right to sell the underlying security at half its current value. 100% moneyness is the right to sell at the current price. Implied Volatility (vertical axis) is not the same as the price paid, far out-of-the-money options are much cheaper than at-the-money, or in-the-money (moneyness > 100%) options. The Implied Volatility, IV, is the level of expected volatility that the $ transaction price implies using the Black Scholes equation.
For 2017, the dispersion tightens further, and as volatility levels decrease, the volumes significantly decrease.
Fewer investors are buying insurance.

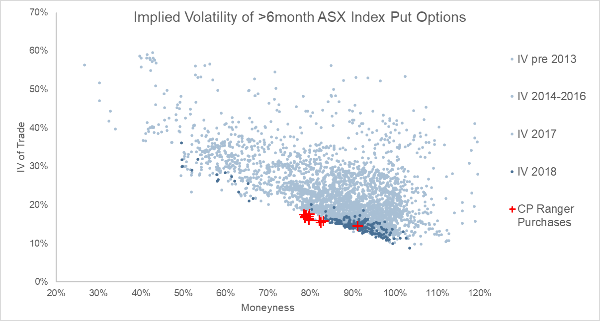
In the first 6 months of 2018 the dispersion widened slightly, and for a shortened 6-month period volumes increased, most likely due to February’s small bout of volatility.
Our analysis also revealed that discipline is required when trading, and a patient buyer is well rewarded.
When we include our own purchases on the same graph, we see the results of this:
The potential payoffs from our insurance vary depending on what actually happens in the future, but for illustrative purposes, we look at two scenarios:
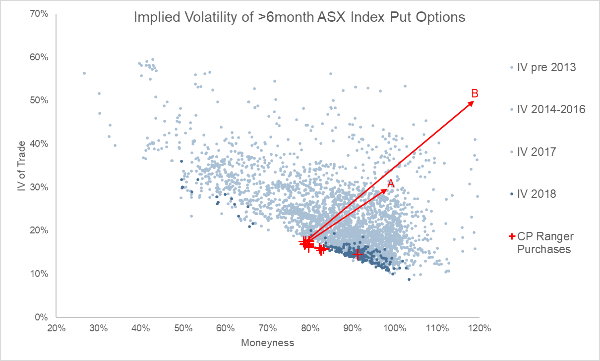
Scenario A
The Index falls 20%, and volatility spikes to 30%. We are not necessarily looking to insure against a scenario such as this (a wobble rather than a crash) but a 1% allocation to put options could quite easily increase in value by a multiple of 5x.
Scenario B
The index falls by 50%, and volatility increases to 50%. This is the financial Armageddon scenario, similar to the GFC, or the 1930s. Index tracking ETF funds might halve in value, as might a typical fully invested equity index benchmarked fund that makes up a good proportion of typical balanced portfolios. The value of the ‘insurance policy’ could in this event increase in value by 20x meaning a 1% investment in put options could cover a roughly 20% fall in the price of other investments in the fund.
The one thing we can be certain of is that we are unable to accurately anticipate how a future market crash could be triggered, or what will happen if it does. Investors should remember the above scenarios are only scenarios, not forecasts.
However, in our opinion, heightened financial market risks and reasonably priced premiums make portfolio insurance via put options a compelling option.
| « Key themes and conclusions from the past 10 years | Investing: The future of sustainable property » |
Special Offers
Comments from our readers
No comments yet
Sign In to add your comment
|
|
Printable version |
|
Email to a friend |

