

What can the past two years tell us about markets in 2019
As we move into the New Year, it’s always interesting to reflect on what has just happened in the previous year. Looking back to the past can offer insights into the future, however, it is important that we don’t anchor our expectations of future performance solely on what has just happened.
Tuesday, January 22nd 2019, 12:00PM
by Karl Geal-Otter

Karl Geal-Otter, Pathfinder Asset Management
Over the break, there was a great piece written by Ben Carlson on his Wealth of Common Sense blog (if you are unfamiliar with Carlson and the blog, I highly recommend it, the link is here). In the post, Carlson breaks down the 2017 performance of the S&P 500 and compares it with 2018.
There was the obvious conclusion, 2017 was a much better year for markets than 2018, but digging down into the details revealed a lot of interesting facts. For example, the S&P 500 had zero negative months during 2017, something that has never happened in its history, and daily annualised volatility was around one-third of its long-term average. Bringing it back home, this article will look at similar statistics for the NZX 50. Will the comparison yield similar results?
Before we compare the two calendar years, is the previous year a good predictor of the next?
In Carlson’s post, he also references work done on the Dow Jones Industrial Average. The long history of the index lends itself to making reasonable probability assumptions.
One observation is that since 1896 the Index had a positive calendar year return about 65% of the time; we could, therefore, infer that the probability of the Dow Jones increasing in a given year as roughly 65%.
Interestingly the data also shows this number doesn’t change significantly when factoring in what had happened the previous year. When markets were either up, up at least 20% or down in a previous year the probability of a positive return the following year was not statistically different from all years 1.
It’s a little tricky to run a similar analysis on the NZX50 which has a much shorter history (and even shorter available data series). From 2001 the NZX50 has risen on average three out of every four years, with the only consecutive negative years being 2007 and 2008 (-0.3% and -32.8%, respectively).
The defensive nature of the NZX50 and its lower average volatility than the Dow Jones (10.9% vs 17.8%) could explain the higher persistence of returns. While on average we can expect the Dow Jones and the NZX50 to be up in a given year, the previous years results are not a great predictor of the next year, so we must be cautious of anchoring bias.
The next part of this article will breakdown the last two years and reinforces how different two calendar years can be.
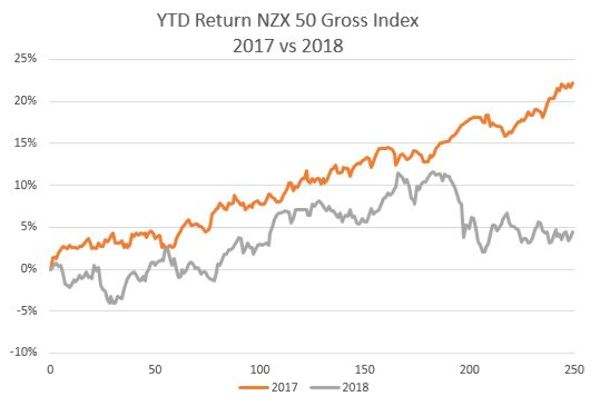
As was the case in the S&P 500, 2017 was a much better year for the NZX50 than 2018, slowly grinding its way to a 22% return.
Unlike 2017, which was up 2.5% within 10 trading days, 2018 started off with a loss of 2.2% in the first 9 days, and by day 30 was down a fraction over 4%. By mid-September, however, it had clawed its way to an 11.5% gain.
But, the NZX50 couldn’t hold off the global stock market sell-off, declining 6.4% during October and finishing the year up a volatile 4.6%. That’s the high-level overview, let’s break it down.
- All-Time Highs: in 2017 there were 52 new all-time highs, that’s one every five trading days. Surprisingly, 2018 came in with 32, a respectable number given the increased volatility.
- Maximum drawdown: this is the maximum drawdown from peak-to-trough within each year. The slow and steady nature of 2017 meant its largest drawdown was just 2.1% and had recovered back to the previous peak in just 19 trading days. The story was quite different in 2018, with a maximum drawdown of 9% from its September peak. At the time of writing, the NZX50 has still not recovered the loss.
- Negative months: like the S&P 500, the NZX50 had zero negative months in 2017, something that has never happened going back to 2001 (the longest data available on Bloomberg). Suffering five negative months, 2018 couldn’t repeat the previous year’s heroics although 4 were minor losses, with the outlier October, down 6.4%.
- Annualised daily volatility: slow and steady won the race for 2017 with daily annualised volatility of just 6.7%. Volatility during 2018 came in 50% higher, 10.4%. To highlight what a standout year 2017 was the daily annualised volatility going back to 2001 is 10.9%.
- 1% moves: it was all about the slow grind in 2017 with only four days down more than 1% and three days up by more than 1%. Calendar year 2018 had three times as many days with 1% or greater losses, along with 13 days up more than 1%. It also had two days where the index was down more than 2%. This breakdown helps explain how 2018’s volatility was 50% greater than in 2017.
- Risk-Adjusted Return: the low volatility of 2017 gave it a mouth-watering Sharpe ratio of 3.3, significantly better than 2018’s, 0.44 (Assuming a cash rate of 0%).
- Quarterly returns: quarter to quarter returns shouldn’t be scrutinised as it’s far too short an investment time period, however, it does show just how spectacular 2017 was. Comparing the worst quarters in each year; Q3 2017 returned 4.1% vs Q4 2018 which lost 5.7%.
The last few comparisons of the S&P 500 in Carlson’s blog are like our own experiences in the NZX50. The calendar year 2017 was a slow grind it up year where losing money seemed almost impossible and will go down in history as a standout.
Contrasting 2017 with 2018, volatility increased, and it became a very difficult place to make money, especially the back end of the year.
What will 2019 bring for investors?
As this simple breakdown shows two calendar years can have very different results. We shouldn’t, therefore, rely too much on the previous year when making predictions about the coming year, it’s much more important to consider forward looking factors.
We will still do it because that’s human nature, but we should also remember it is important to be aware of our tendency to anchor decisions on past results.
Karl Geal-Otter is an investment analyst at Pathfinder Asset Management, a boutique responsible investment fund manager. This commentary is not personalised investment advice - seek investment advice from an Authorised Financial Adviser before making investment decisions.
| « Top 10 Dow Jones Industrial Average Factoids – 2018 in Review | Vale Jack Bogle » |
Special Offers
Comments from our readers
No comments yet
Sign In to add your comment
|
|
Printable version |
|
Email to a friend |

