Risk Parity – Models and Myths
On a recent visit to one of the external managers of our 5 Oceans Fund we asked them for their biggest market worry. The rise of risk parity strategies was the answer.
Tuesday, April 16th 2019, 7:00AM
by Castle Point Funds Management

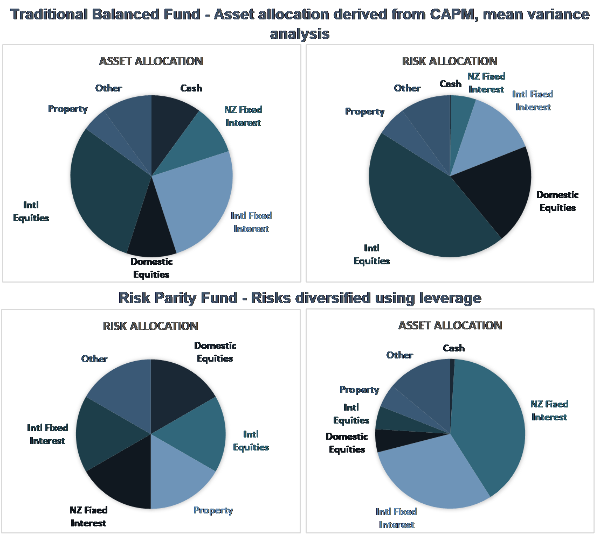
Risk parity strategies are an alternative to the traditional balanced portfolio. The strategy came into being in the 1990s but drew increased attention after the 2007-2009 global financial crisis refocused investor attention on risks in the share market, and on hedge fund strategies to minimize those risks.
In a traditional balanced strategy you increase your expected return by increasing your exposure to growth assets, predominantly equities. As a result, the higher your expected return, the higher your exposure to equity risk. The goal of risk parity is to build a diversified portfolio where each group of assets contributes an equal amount of risk so that the return is not primarily determined by equities.
The allocations are based on research on how each asset performs and relates to the other groups over time. To increase your expected portfolio return you leverage up the least volatile investments, such as bonds.

Sounds compelling! Who wouldn’t want a more diversified portfolio? But risk parity is not necessarily optimal just because risk is better diversified. It needs to earn you a better risk-adjusted return. There is however a theoretical argument for why this might be the case, the theory of leverage aversion.
In 1972, Fischer Black presented an academic study showing that assets that are less volatile will offer higher risk-adjusted returns than more volatile assets if some investors are averse to leverage. Leverage aversion breaks the standard CAPM, the model behind the theory for traditional balanced funds. A less leverage averse investor can benefit by overweighting less volatile assets, underweighting more volatile assets, and applying some leverage to the resulting portfolio. See here for a paper discussing this in more detail. Add to this theory some evidence of outperformance over the traditional balanced portfolio during market shocks like the GFC and the result is a strategy that is currently highly in-favor.
Estimates vary regarding how much is invested in this strategy. It is most associated with Bridgewater Associates, the world’s largest hedge fund, which launched its risk-parity All Weather Fund in 1996. Other major investors in the space include AQR Capital Management, whose founder Cliff Asness is also a well-known investor. In February 2018 AQR estimatrd that around $70 billion was invested in equities via this type of strategy. The amount in fixed income assets could be over ten times that number.
Risk-parity strategies are the poster child for a whole set of investment strategies that are sensitive to volatility, such as risk-parity funds, volatility targeting funds, and trend followers. A 2017 paper by LongTail Alpha chief investment officer Vineer Bhansali and USC Marshall School of Business professor Lawrence Harris estimated that total assets under management in strategies that respond to risk inputs is about $1.5 trillion. This puts a lot of money in the hands of quant-driven strategies that rebalance on changes in volatility.
And why might some investors be averse to leverage? Perhaps because imprudent leverage can result in total loss of capital, even if the underlying asset is relatively safe. These strategies are essentially leveraged bond portfolios with some equities. If they become too popular, they will distort the markets they operate in and the theory that was used to build them will no longer apply. Look no further than CDOs as good example of how practice kills theory if a strategy becomes too popular.
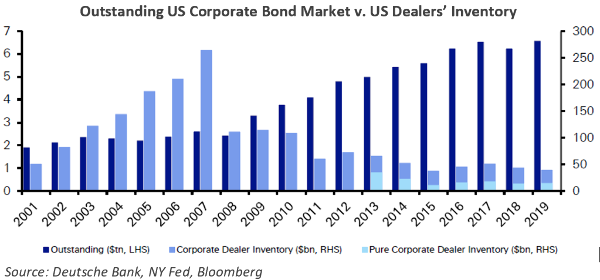
A disturbing current trend is the declining liquidity in bond markets. The chart below shows total outstanding corporate bonds versus the amount held as inventory by bond dealers, predominantly the banks. Banks have historically used this inventory to trade bonds on their own balance sheet, facilitating liquidity, but this inventory has dried up as banks have de-risked their balance sheets and responded to regulatory changes. This is a seismic shift that might make the data used to created risk-parity strategies irrelevant.

Market volatility has been running at historically low levels. If volatility rises, many of these funds will have to de-risk systematically. Add to that declining liquidity in bond markets and you really do have a formula for turning model into myth.
| « Market Outlook: Records broken | Finding the Next Xero » |
Special Offers
Comments from our readers
No comments yet
Sign In to add your comment
| Printable version | Email to a friend |


