Mercer survey: A volatile quarter
Find out how wholesale managers fared in the past quarter, and how their portfolios are allocated.
Sunday, May 2nd 1999, 12:00AM

The past quarter was characterised by volatility in the bond markets and notable movements in exchange rates. Long bond yields increased in most countries, including a slight rise in New Zealand. Short-term rates fell significantly in January, before climbing to nearly the same level as at the end of December. In March, the Reserve Bank launched its first Official Cash Rate at 4.50 per cent.
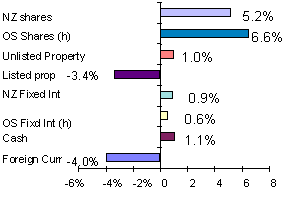
Financial markets had generally positive results, as measured by recognised benchmarks. The following chart presents the market index returns for the quarter.

Overseas equities continued to soar, with the US Dow Jones index breaking through the psychological 10,000-point barrier. Of the major markets, Japan was the most buoyant, rising by nearly 18 per cent for the quarter in local currency terms.
Domestic shares were also buoyant. The 5.2 per cent return was the strongest start to a calendar year since 1991. The strongest returns came from the leading stocks. Listed property, however, fell significantly.
The NZ dollar rose significantly over the quarter against most major currencies, which offset the local currency returns for unhedged international investments. The TWI rose by 4.2 per cent over the quarter, with the largest rises against the newly launched Euro and the Yen.
The inflation figure for the March quarter was again negative (-0.3 per cent), leading to a negative headline inflation rate for the year (-0.1 per cent) for the first time since 1946.
|
Manager |
Past investment returns (before both tax & expenses |
Past 3 Years Risk |
|||||
|
|
3 mths |
1 yr |
3 yrs |
5 yrs |
7 yrs |
Volatility %pa |
Sharpe Index |
|
AMP Asset Management |
3.4 |
11.2 |
14.2 |
11.7 |
13.0 |
7.4 |
0.9 |
|
ANZ FM |
3.0 |
12.4 |
14.8 |
12.7 |
14.2 |
7.6 |
1.0 |
|
Armstrong Jones |
4.4 |
14.1 |
16.3 |
13.0 |
14.1 |
7.2 |
1.2 |
|
BNZ |
2.9 |
11.9 |
15.6 |
12.2 |
11.8 |
6.8 |
1.2 |
|
BT |
2.8 |
9.7 |
13.1 |
11.8 |
N/E |
7.8 |
0.7 |
|
Citibank |
2.9 |
12.8 |
14.0 |
10.7 |
12.7 |
8.7 |
0.7 |
|
Colonial First State |
2.3 |
11.1 |
10.2 |
9.1 |
11.2 |
6.0 |
0.4 |
|
Guardian Trust |
3.1 |
11.6 |
15.7 |
13.1 |
14.0 |
6.7 |
1.2 |
|
National Mutual |
2.0 |
8.0 |
12.2 |
10.7 |
12.1 |
8.5 |
0.5 |
|
NZ Funds |
4.7 |
13.7 |
15.6 |
N/E |
N/E |
7.9 |
1.0 |
|
Royal & SunAlliance |
2.4 |
11.5 |
12.6 |
10.5 |
12.9 |
7.3 |
0.7 |
|
Spicers |
2.0 |
11.0 |
N/E |
N/E |
N/E |
N/E |
N/E |
|
Tower |
2.1 |
8.8 |
14.1 |
13.0 |
13.2 |
5.9 |
1.1 |
|
WestpacTrust |
2.2 |
11.0 |
12.3 |
9.6 |
10.6 |
7.2 |
0.7 |
|
Managed fund index |
2.2 |
11.4 |
14.6 |
11.4 |
12.4 |
6.8 |
1.0 |
|
Median |
2.9 |
11.4 |
14.1 |
11.8 |
12.9 |
7.3 |
0.9 |
During the quarter the general trend in asset allocation mixes has been away from fixed interest locally and internationally and towards bonds and New Zealand shares. There has been very little movement in New Zealand property holdings. The current asset allocation was as follows:
International shares 26.6 per cent, New Zealand shares 21.5 per cent, New Zealand fixed interest 20.5 per cent, overseas fixed interest 13.8 per cent, cash 9.5 per cent and property 8.1 per cent.
The asset alloactions of each wholesale manager as at March 31 is detailed below.
|
Manager |
Current Asset Allocation |
|||
|
Cash |
Fixd Int |
Shares |
Prop |
|
|
(NZ/overseas as a % of fund size) |
||||
|
AMP Asset Mgmt |
9/0 |
27/7 |
26/23 |
8/0 |
|
ANZ FM |
7/0 |
25/8 |
22/31 |
5/2 |
|
Armstrong Jones |
2/0 |
26/7 |
27/26 |
12/0 |
|
BNZ |
4/0 |
15/33 |
22/26 |
0/0 |
|
BT |
13/0 |
17/16 |
26/22 |
6/0 |
|
Citibank |
14/0 |
21/5 |
31/29 |
0/0 |
|
Colonial First State |
0/0 |
0/40 |
35/25 |
0/0 |
|
Guardian Trust |
5/0 |
28/12 |
22/27 |
6/0 |
|
National Mutual |
2/0 |
20/14 |
30/20 |
14/0 |
|
NZ Funds |
18/0 |
12/4 |
24/22 |
10/10 |
|
Royal & SunAlliance |
5/0 |
33/5 |
28/23 |
6/0 |
|
Spicers |
7/0 |
23/12 |
21/32 |
5/0 |
|
Tower |
20/0 |
16/16 |
11/27 |
10/0 |
|
WestpacTrust |
14/0 |
15/16 |
15/30 |
10/0 |
| « Research: NZ will benefit from rising commodity prices | King builds an empire » |
Special Offers
Commenting is closed
| Printable version | Email to a friend |


