

Market Review: London January 2009 Commentary
Clearly, the world economy is in a poor state at present and despite our reputation for being less than cheery, even we have been surprised by the extent of the weakness that now afflicts the global economy.
Thursday, January 15th 2009, 3:54PM
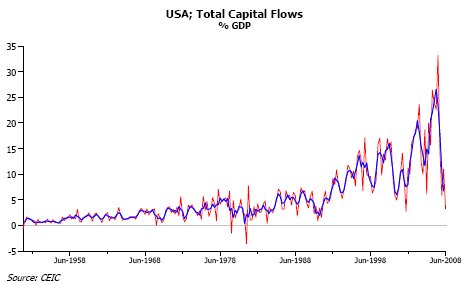
At the centre of this co-ordinated collapse in global activity lies the slump that occurred in the middle part of last year in international capital flows. During the boom years of the mid 2000s, surging international capital flows had allowed many countries – and certainly the vast majority of the OECD – to grow rapidly on the back of easy credit conditions, falling savings rates and rising asset prices.
Countries as diverse as Denmark, Spain, New Zealand, the UK and of course the US each borrowed heavily from abroad in order to augment their low savings rates and so finance huge increases in consumption, property investment and in some cases even productive investment.
Unfortunately, now that these capital flows have abated or even reversed, this spend-thrift behaviour has been obliged to come to an end, most notably in those countries (and this covers three-quarters of the OECD) that possess significant current account deficits in their trade accounts, since without an easy supply of international capital, it is no longer possible to fund these deficits.
Unfortunately, with so many large rich countries trying to, in effect, save more, spend less and close their trade gaps, global trade activity has naturally been weak and export growth has been hard to come by, whatever the level of one’s currency.
Consequently, the onus of the necessary trade adjustments is increasingly falling on the need to cut imports, which of course has been hugely detrimental to world trade trends.
Consequently, with global import growth now collapsing, even the surplus countries are finding downward pressure on their export revenues and this is imposing an income loss on them, as the recent collapse in Japanese and Chinese economic growth rates has revealed.
Indeed, global demand is now so weak that despite what have already been savage production cuts in many countries, inventories of unsold goods are continuing to rise around the world, most notably in the US, Japan and China.
This in turn suggests that we can expect further sharp production cuts in the early part of next year and hence employment can be expected to decline sharply. Consequently, although weak demand may be producing remarkably negative GDP figures in 2008Q4, production weakness will likely cause continued severe economic weakness in 2009Q1.
Clearly, the next six months are going to be a very unhappy time for many of the participants in the global economic system but fortunately we do suspect that the situation may improve a little, at least temporarily, in 2009H2.
We do not expect a sharp recovery in the global economy in late 2009 but we do nevertheless believe that the ongoing easing of monetary policy in the major economies will begin to restore some semblance of stability to the global credit system, although we suspect that growth will remain anaemic at best.
At the same time, the size of fiscal responses now being ‘leaked’ in the US and mooted in Europe should be sufficient to provide the world’s highly indebted consumers with sufficient new cash flow that will allow the sector to pay off at least some of its debts without the need for further dramatic cutbacks in its own expenditure. For the corporate sector, such an end to the nominal income deflation would clearly go a long way to easing the financial strains in that sector.
Therefore, while we do not believe that the fiscal policies will be enough to rekindle global growth, we do believe that by mid 2009 the size of the public injections could be sufficient to stop the negative cycle and produce a degree of stability in the real economy.
It is therefore our view that the massive monetary response of recent weeks, and the proposed fiscal response in early 2009, will be enough to bring stability back to the global economy in mid-late 2009. Presumably, equity markets have begun to sense this and they have naturally rallied, since even stability will mark a dramatic improvement on where we are today. However, we do wonder whether ‘travelling will be better than arriving’ for the markets.
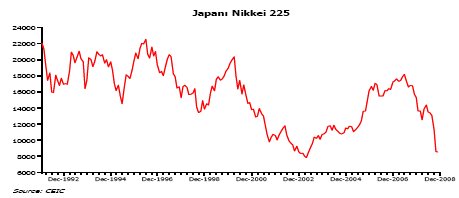
During the 1990s and early 2000s, Japan’s equity market enjoyed frequent and often quite long bull market phases as belief spread that the latest recovery package or rate cut would deliver growth to the economy and, although these packages did succeed in preventing Japan’s economy from entering the type of depression seen in the 1930s or in Asia in the late 1990s, when the markets realised that the effect of a hugely expensive 15-16% of GDP budget deficit or zero interest rates was merely economic stagnation and a ‘disaster avoided outcome’, the equity markets usually sank back to new lows fearing (correctly) that the authorities would not be able to remain expansionary ad infinitum.
Consequently, we do wonder whether at some point in 2009 or even early 2010, financial markets may look at the results of Obama’s $3 trillion spending splurge, the effects of the Fed’s monetary policy actions and the similar events in Europe and conclude that despite the effort and the long term costs to the public purse, the results were unimpressive and probably not sustainable. We suspect that it could well be that at this point the ultimate lows for the equity markets are reached, as they were in Japan.
As for timing such a potential reversal in equity markets, we would suggest that it is unlikely to be before March 2009 (barring unforeseen circumstances) and probably not until the second half of the year, although we shall simply have to watch the speed of the fiscal expansion and monitor its effects as time unfolds.
But, until then, it is possible that the recent rally may continue a while longer, although clearly markets have already come a long way and, as the chart of Japan’s equity market above shows, the period of ‘maximum positive gains’ within the rallies were usually heavily front loaded in the bull market phases.
Andrew Hunt, London
| « 2009 Investment predictions discussed | Market Review: January 2009 Commentary » |
Special Offers
Commenting is closed
|
|
Printable version |
|
Email to a friend |

