

Understanding risk and volatility
In this month’s Pathfinder Commentary John Berry looks at what volatility means as a measure of risk. While volatility is widely used to identify investment risk for managed funds, it has a number of “real world” limitations. What are these limitations and what do these mean for investors?
Monday, June 9th 2014, 11:23AM  2 Comments
by Pathfinder Asset Management
There is no single definition of what risk means for investors. According to legendary value investor Ben Graham risk is “the possibility of not getting your capital back.” That is consistent with how many investors see risk – and was an entirely appropriate way to have thought of investing in finance companies pre-GFC. This is essentially the measure of risk that credit rating agencies give us when investing in corporate debt.
Risk and modern portfolio theory
Harry Markowitz (the father of modern portfolio theory) defined risk differently. He identified it as having two characteristics:
- Volatility of return
- Systematic and non-systematic risk
We are going to focus on part 1) of the definition (volatility) but let’s quickly look at part 2). “Systematic risk” is all risk inherent in a portfolio that cannot be mitigated by diversification. Influences such as interest rate changes, war, recession and political change impact entire markets and not only individual companies. If you are invested when markets are dealing with significant political change (a systematic risk) there is nowhere to hide no matter how diversified your portfolio may be.
By contrast “non-systematic risk” is risk related to a particular company. This includes, for example, the likelihood a company will default on its loans, launch poorly designed products or lose key staff. Non-systematic risk can be mitigated by diversifying across a large number of companies so that the portfolio can survive with the unexpected failure of one.
In a Markowitz world risk is defined as the standard deviation of periodic returns. For managed fund returns risk is often expressed as “the volatility of returns for the fund is 8.0% per annum.” But what does this really mean? A quick refresher on volatility never hurts.
The normal distribution
In our biological world most outcomes of repeated events are consistent with a “normal distribution” (also known as a “Gaussian distribution” after German mathematician Carl Friedrich Gauss). If you are looking for them, bell curve distributions appear everywhere around us for example the lifetime of a manufacturer’s light bulbs and the heights of financial advisers at an industry conference.
By way of reminder, randomly selected observations of events following a “normal” distribution should allow us to assume that:
- About 68% of times (actually 68.2%) we observe the event the outcomes fall within one standard deviation of the mean (i.e. 34% either side of the mean)
- About 95% of outcomes (actually 95.4%) fall within 2 standard deviations of the mean (i.e. 47.5% either side of the mean)
- Almost 100% of outcomes (actually 99.7%) fall within 3 standard deviations of the mean
This is probably more easily understood by way of illustration:
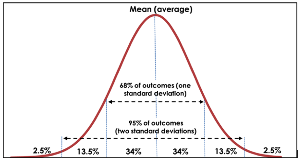
Source: Pathfinder
Volatility for managed funds
Now back to our managed fund example – what does it mean when a fund manager says “the volatility of returns for the fund is 8.0% per annum?” Firstly, the “volatility of returns” is a reference to one standard deviation (about 68% of outcomes). The manager’s statement means that if the distribution of fund returns follows the same pattern as the past, and is normally distributed, then there is a 68% chance that this year’s return will fall somewhere in the range of the average of prior years plus or minus 8.0%.
So if the average of prior year returns was 10.0% then there is a 68% likelihood that the current year’s return will be 10% +/- 8% (so a 68% probability the return will fall within a range of +2% to +18%). But there is also a 32% chance that it won’t fall within these bounds.
As an investor a higher level of certainty than 68% would be helpful. What if we want 95% confidence? This is 2 standard deviations. The answer is calculated as follows:
- One standard deviation is 8% so 2 standard deviations is 8% x 2 = 16%
- The average historic return is 10%, so the range of possible returns with 95% confidence (2 standard deviations) is 10% +/- 16%
- This gives a 95% confidence range of -6% to +26% per annum.
For an investor this may seem a wide range given the “headline” volatility is only 8%. Note if we wanted an even higher (almost 100%) confidence then the range would be the average return +/- 8% x 3 so -14% to +34% per annum.
Normal distributions and financial markets
This is all very useful, except for the inconvenient truth that in the real world financial markets do not always behave as they have in the past. Nor do they conveniently follow normal distributions. Unexpected extreme events (often called “fat tail” or “black swan” events) are a lot more common in financial markets than the bell curve would suggest.
This is well illustrated in the graph below by S&P500 monthly returns since 2000. Along the x axis (horizontal) we have “buckets” of returns (i.e. monthly returns of -2% to -1%, 0% to 1%, 1% to 2% etc) while on the y axis (vertical) we have the number of months (frequency) since 2000 that have fallen into each return bucket. In reality this isn’t that close to a bell curve distribution. See in particular the left hand side extreme months that aren’t reflected on the right hand side of the curve. The real world curve is not symmetrical and also has unexpected “humps” either side of the mean:
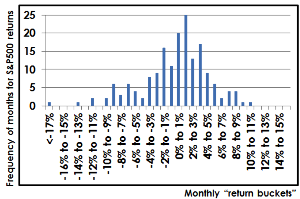
Source: Pathfinder, Bloomberg
In times of market stress many widely held assumptions about markets and pricing can prove to be wrong. The GFC was notable for many financial models failing. A great example was a global investment bank where the CFO described the 2007 losses of its flagship hedge fund as “we were seeing things that were 25 standard deviation moves, several days in a row.” Really?
The probability of a normally distributed event occurring at the 7 standard deviation point is infinitesimally small – it could be expected to happen once in 4 million years…. An event at 25 standard deviations is just too unlikely to comprehend (the number 10 followed by 136 zeros!)…. and for that to happen on each of 3 consecutive days….. Rather than the investment bank experiencing extraordinarily bad luck, what actually happened is that markets were not behaving in a convenient normally distributed fashion (and therefore key financial modelling assumptions were wrong). They weren’t very unlucky, they were careless.
Final thoughts
In short, volatility of return is a useful guideline measure for investors. But keep in perspective that it has limitations:
- It anticipates that future investment returns will be “normally distributed” when in reality they are very unlikely to be.
- It is based on past returns which (as every offer document tells us) are not an indication of future investment results.
- It is a measure of one standard deviation of returns and so gives only a 68% expectation (99% confidence is 3 standard deviations giving a theoretical range three times as wide).
Sadly the normal distribution model (which is so heavily relied on for modern portfolio theory) isn’t so normal when it comes to real markets. It is a useful tool but investors must be mindful of its limitations.
John Berry
Executive Director
Pathfinder Asset Management Limited
Pathfinder is an independent boutique fund manager based in Auckland. We value transparency, social responsibility and aligning interests with our investors. We are also advocates of reducing the complexity of investment products for NZ investors. www.pfam.co.nz
| « Ditching fossil fuels will pay off: Fund manager | Not the New Year markets we were expecting » |
Special Offers
Comments from our readers
Well done John!
Sign In to add your comment
|
|
Printable version |
|
Email to a friend |


https://www.academia.edu/attachments/32259282/download_file?st=MTQwMjI5Njk5MiwxMjIuNjIuMTM0LjEwNCwxMjIxMDEy&ct=MTQwMjI5NzAwMywxMjIxMDEy
Similarly in Why Distributions Matter you can see the extent to which ETF's and Hedge Funds are Normal.
https://www.academia.edu/attachments/32667379/download_file?st=MTQwMjI5Njk5MiwxMjIuNjIuMTM0LjEwNCwxMjIxMDEy&ct=MTQwMjI5NzAwMywxMjIxMDEy