

Market Review: October 2008 Commentary
The global financial system entered waters in the past month that even those who have been in the markets for some considerable time had not experienced. So this time even grey hairs didn’t matter! Greg’s bump last month was a thump in the later days of September.
Monday, October 6th 2008, 6:11AM
The question of trust between institutions lending to each other has been sorely tested, as shown by the increased spreads between Government and private sector lending rates; and no economy, whether developed or emerging, has been immune as outlined by Peter Lynn.Helen McKenzie, Head of Distribution, Tyndall
If you can find me anyone working in the financial sector who has seen more action in the markets than what transpired over the past month, then that person must be over 100 years old. Because the collapses, bailouts, injections and market falls were of such a level, especially in the second half of September, that the world has not experienced anything like this since the Great Depression in the 1930s. I do not need to recount all of the events here – there are numerous timelines available online at various news outlets; in any event, it often made the lead news item in the media, such was its global significance.
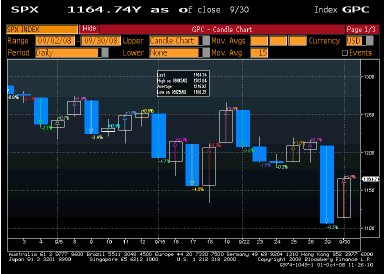
In the very first article I penned for these Comments, in April 2007, I noted that there had been two (yes, only two) days in which the DJIA index had fallen by more than 2%. At the time, I drew concern to this about a possible correction in the US market, as there had been no such fall in 2006 of more than 2% and, in the 18 months prior to the 1987 and 1929 crashes, the numbers of 2% daily falls in the DJIA increased alarmingly. If those five weeks in the first quarter of 2007 were the start of another 18 months of increasing numbers of large daily falls, then we have seen its realisation in September 2008. Look at the chart below for a volatile month (it is for the S&P 500, but is similar to the DJIA picture):
The blue bars represent daily falls and I can count six in the month that were larger than 2.5%, with the massive fall at the end after the lower House in the US rejected the first USD700b bailout proposal.
I have heard a few commentators saying that New Zealand is somewhat immune from these problems, as we do not have a banking sector, and the problems fundamentally relate to the inability of US and European banks to supply credit. I beg to differ from the view that we are not exposed to these problems, as they are entrenched in the global economy. This is exactly why the Fed bailout has to be passed (as I write this, the Senate has approved it, but it is one day away from a House of Representatives vote) and why its veto on 29 September (US time) caused such chaos on global markets. The US Government is really one of the few institutions left with the size and the patience to be able to bail out the impaired assets of the major global banks and to allow the credit markets to begin to function again. Without this bailout package, the repercussions to the whole global economy, including little New Zealand, would be immense. New Zealand businesses and households will, just like their US counterparts, find it harder and harder to get anyone to lend money to them and the cost of that borrowing will rise appreciably. This is not conducive to economies like ours that are already in recession.
The New Zealand sharemarket seems to agree with this view and a similar chart to the one earlier showed that New Zealand experienced a relatively similar level of volatility to the US market:
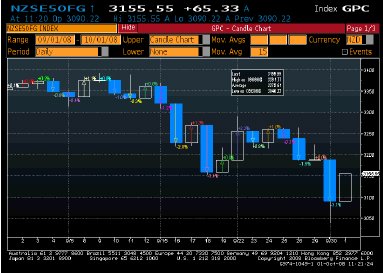
Admittedly, the NZ market had smaller falls, which makes sense, but there were still three daily falls larger than 2.5%. The trend, especially in the second half of the month, is similar to the US experience.
Is this really as bad as the (brief, except in New Zealand) 1987 crash, or even the 2001-2002 tech wreck? There is a little-known indicator of perceived credit risk in the general economy called the “TED spread”. It is basically the difference between the 3-month interest rates that banks lend to each other at (called LIBOR – the London Inter-Bank Offered Rate) and the 3-month USD Treasury bill rate. The chart below shows the weekly levels of the TED spread from just before the 1987 crash (when it was at a record level) and the period up to just before the “no” vote on the bailout plan.
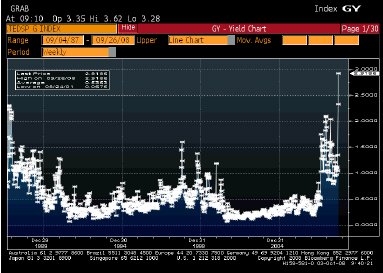
The usual level of the TED spread is around 0.5% or lower. During times of financial stress, it spikes up. But just look at what has happened over the past month. The level blasted above the 1987 record. In fact, if the chart went on another week, it would show a new record of 3.5% being struck on September 29. No-one wants to invest in bank debt any more, as it is deemed too risky (nor do banks want to lend to each other, either). Three-month Treasury bills now yield 0.6%, due to the massive flight to quality. In fact, at one stage in September, one month T-bill yields were -1%. That is not a mark on the page – it is a negative yield. In effect, buyers were so scared that they were prepared to pay the US Government to look after their money for them for a month. Until the bailout plan is approved, then the current yields will go lower.
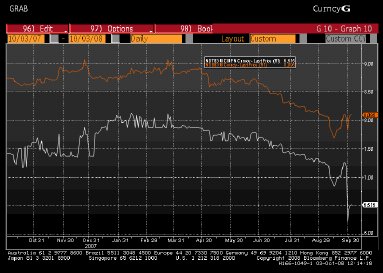
But surely, New Zealand (or, really, Australian) banks are not having these same troubles in lending to each other? Well, a similar comparison to the TED spread for New Zealand reveals the following. The chart is a comparison of the 90-day Bank Bill yield curve and the 90-day NZ Treasury Bill yield curve.
The spread between the two looks fairly consistent over time, until we get to the very end of the period. When the financial crisis hit at the end of September, there was a corresponding dramatic expansion of this spread. So, while the T-bill curve has fallen by 0.9% over the month of September (with a large drop on the very last day), the 90-day Bank Bill rate fell by about 0.2%. This increased differential is a function of the funding concerns that banks here have.
We have to assume that the US bailout will be approved (the sooner the better). Then, I think we have started on the endgame for this financial crisis. That doesn’t mean that the end is near – the endgame could be somewhat protracted. What is certain is that there is a lot more volatility to come from the markets over the remainder of the 2008 year at least and to continue well into 2009. There will be some equity market rallies and some (probably large) falls.
Finally, we expect to see central banks cut interest rates over the next few months. Certainly, the RBNZ will continue its interest rate easing cycle, possibly quite aggressively. There could well be further injections from central banks as well and we probably have not seen the last of the bailouts or nationalisations of financial institutions.
All in all, let us remind ourselves that these are unique times. While it is extremely challenging for investors, businesses and the general public alike, it is fair to say that this industry and this particular time in history is anything but boring.
Peter Lynn, CFA, Head of Strategy
| « Market Review: September 2008 London Commentary | Market Review: London October 2008 Commentary » |
Special Offers
Commenting is closed
|
|
Printable version |
|
Email to a friend |

