

Match racing: NZ PIE funds vs US ETFs
Some commentators point to the low fee structures of US ETFs and question why an investor or adviser would even consider NZ managed fund solutions. The purpose of this article is to provide a “real life” comparison of a PIE fund against US equity ETFs with similar exposure. Is one structure better?
Tuesday, June 13th 2017, 8:12AM  18 Comments
by Pathfinder Asset Management
Equity ETF background
There are an astonishingly large number of equity ETFs listed in the US – in fact there are over 1,300. The average expense ratio (total management fee) for large cap equity ETFs is 0.39%. For broad equity ETFs covering all market caps the average expense ratio is higher, at 0.51%. Some (but far from all) US equity ETFs are very cheap and can have an expense ratio less than 0.10%.
Below, we provide a “real life” US ETF vs NZ PIE fund expense comparison by matching a Pathfinder PIE fund against the US ETF alternatives. This is not intended as a product push, but rather it is intended to be a reasoned example of how the low fee ETFs are not always the cheap solution they appear to be. Investors and advisers need to look further than simply the headline expense ratio.
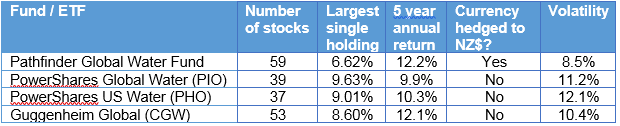
Pathfinder’s Global Water Fund is a niche equity fund directly investing in water industry stocks which can include industrials, utilities, tech and materials companies. There are several US ETFs that also invest in the water theme. Let’s start by comparing the headline expense ratios:
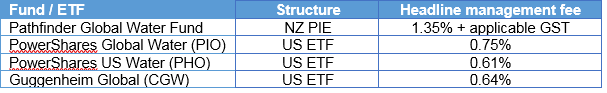
On the face of it, the PIE fund has about twice the costs of comparable ETFs. But this comparison is far too simplistic. Please read on…
ETFs – management fees aren’t tax deductible
For a start, costs inside a NZ PIE are tax deductible, while with FDR tax on the ETFs there is no tax deduction (in this example we are assuming FDR tax applies on the US ETFs. The analysis is different if CV tax treatment applies). This makes the biggest difference to a 28% PIR tax rate which we show below (it makes no difference for a zero PIR):
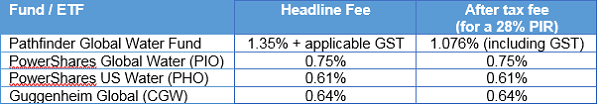
The tax deductibility of fees narrows but does not entirely close the gap between the PIE and ETFs. But there is more to come…
PIEs – the PIR benefit
For a high rate taxpayer, investing in a NZ PIE has another key benefit – capping the tax rate at 28% (compared to the top marginal tax rate of 33%). This sounds like a trivial benefit, but it is significant. Where FDR tax applies, the difference works as follows:
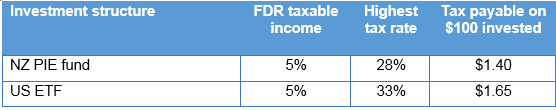
For a high rate taxpayer with FDR tax on the US ETF there is a clear benefit to invest through a NZ PIE fund. The tax saved adds 0.25% per annum to the investment return through a PIE. Because of the nature of FDR tax (assumed 5% return regardless of how the asset performs) this benefit applies whether markets are rising or falling.
ETFs - custody fees can hurt
Investors who hold US ETFs will typically pay a custody fee to the offshore sub-custodian. For example, if the ETF is purchased through a NZ broker, it appears to be held in the custody account of the NZ broker. It is, however, held by a sub-custodian offshore (the sub-custodian holds it for the NZ broker who in turn holds it for the NZ client). The offshore sub-custodian will charge a fee for holding the ETF - this may not be an obvious or transparent fee. The charge is likely to be at least 0.20%.
By comparison, the NZ PIE may have a much more efficient custody structure. In the case of the PIE fund we are comparing here to US ETFs, there is no custody fee incurred in the Water Fund’s sub-custody arrangement. This is a saving of 0.20% (and possibly more) through the PIE structure.
Putting it all together
If we aggregate these numbers we see the “cheaper” US ETFs suddenly aren’t any cheaper. In fact, some that, at first glance, appear much cheaper are in reality more expensive for a 28% PIR investor where FDR tax applies:
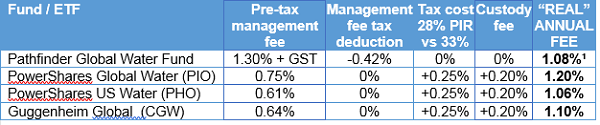
The headline price doesn’t give the full story. It’s like signing up for a $50 a day rental car and later finding the real cost is $100 a day after the rental company adds insurance, an excess waiver and a roadside assist charge.
But wait, there’s more…
There are a few other issues to be taken into account by an adviser when considering if clients should hold US equities directly or via an NZ PIE. These are difficult to quantify, so are not included in the table above, but are further benefits of using PIEs:
- The NZ PIE pays tax for each investor in the fund, so there is no need to do any tax calculations. This is a significant compliance benefit (saving time and accountant’s fees).
- Withholding tax on dividends can get trapped in an offshore investment entity (i.e. an offshore fund or ETF) meaning an NZ investor may not benefit from withholding credits. Any tax leakage will be an additional cost of an offshore ETF (this is very complex area and quantifying the cost will depend on different circumstances).
- Entry and exit can also be more expensive for direct investment in a US ETF. The brokerage charge (often 0.70% or more for offshore transactions) is significantly more than the bid/offer spread for investing in a NZ PIE (often +/-0.10% for entry or exit).
Summary of the US ETF vs NZ PIE match race
So in summary:
- When an adviser compares investment in a US ETF to an equivalent exposure through a NZ PIE, the headline management fee only tells part of the story. It does not provide a true and complete comparison.
- The benefits of investing through a NZ PIE increase as the investor’s tax rate increases (an investor on the top 33% tax rate receives the most significant tax benefit).
- In the worked example above (the Pathfinder Global Water Fund vs US water ETFs assuming FDR tax applies) we see that at first glance the NZ PIE looks significantly more expensive. But if we provide a true like-for-like comparison including custody fees, tax rate differentials and the benefit of a tax deduction for the management fee in a PIE, we see in fact there is no fee difference. The comparison between the investment options should then focus on what provides an exposure suited to the investor – such as concentration, diversification and currency hedging²:
Many (but far from all) US ETFs are very cheap. This is particularly true for broad market exposure where headline management fees can be below 0.10%. However, investors and advisers need to do a complete comparison when looking at US ETFs against NZ PIE fund options. There is a lot more involved than simply comparing headline management fees.
John Berry
This commentary is not personalised investment advice - seek investment advice from an Authorised Financial Adviser before making investment decisions.
¹ The 1.08% cost includes GST
² Sources: Bloomberg and company websites. Data to 31 May 2017.
Pathfinder is an independent boutique fund manager based in Auckland. We value transparency, social responsibility and aligning interests with our investors. We are also advocates of reducing the complexity of investment products for NZ investors. www.pfam.co.nz
| « Canterbury economic activity still robust | Traditional balanced funds - return free risk? » |
Special Offers
Comments from our readers
Hopefully someone who understands this stuff will be along to agree/critique.
I do note that the outcome looks situational.
For instance if someone has all their assets held by a Custodian (so pays the same custody fee on a PIE or ETF) then the ETFs again become cheaper.
Further, non-ETF index funds (eg Vanguard funds in Australia) don't have custody and brokerage costs so may be cheaper.
So to some extent this is a debate about custody and choosing the structure of index investments.
It would also be interesting to see this analysis done with very low cost mainstream ETFs. For instance how does the Pathfinder World Equity Fund line up against index ETFs/offshore index funds?
Let’s use the iShares ACWI ETF with its 0.33% expense ratio as the US ETF. Accounting for custody and tax per the article the total expense ratios of US ETF vs PIE is 0.78% (ACWI) to 1.11% (PIE) - before you ask, this PIE cost includes all synthetic and other costs such as brokerage at the fund level). So the starting point is a 0.33% per annum difference in favour of the ACWI ETF. But that is not the end of the story - let’s apply this to a practical example of your client buying $100 of the ACWI ETF and $100 of the PIE fund and exiting after 5 years.
Assume (1) they pay 0.60% buy/sell brokerage for the ACWI (2) 0.05% buy/sell spread for the PIE and (3) global equities rise by 6.0% pa over the 5 years. At first glance (headline management fee comparison) the ACWI ETF wins all day long, but how do the numbers stack up if you include your client’s transaction costs over the 5 years? Invest $100 on day 1 - the $100 ACWI investment ends at $119.08 and PIE fund ends at $118.47 (each after fees and tax). The difference is 0.10% per annum.
Including the transaction costs it looks like a pretty even match race … though the exposures are not a true “apples with apples” comparison which is the point of this article. A low cost passive PIE fund (Superlife, Simplicity or ASB) would provide a better like-for-like comparison against the ACWI ETF – I’m guessing such a comparison would favour the passive NZ PIE.
On your reasoning is every active fund that does not follow passive geographic and sector weightings “esoteric”?
In my view the Water Fund is a satellite fund in the global equity asset class – but with different return, volatility and correlations when compared to the broader market. It's not exotic or esoteric. (I know I’m not totally objective as manager of the fund (!!) but interested in how other advisers would see it).
The calculations are complicated - and for example I have not included withholding tax drag which will absolutely be a further cost for a US listed global equity ETF.
The point is rather when considering an offshore ETF product for a client take account of all costs - tax, custody, transaction fees etc.
Don't just choose off its headline fee - the headline is never complete information. Thanks
You asked what other advisers think well here goes. I agree with R1. Why would investors favour water stocks over REITs over chip makers over cigarette companies over car manufacturers etc etc. I will tell you why: it is because they have read some research saying that water has a great outlook. There are two problems with this approach: firstly everyone is reading that info at the same time and secondly the advisor is not reading the research that says chip makers are the place to be, or cigarette companies are undervalued or car manufacturers are going to outperform. So yes you can make a case for water but it is well known so factored into prices. The fund is esoteric because it is focussed on just 59 direct holdings associated with water versus 5,000 stocks spread over different sectors in a Vanguard world fund for example.
Second question “every active fund that does not follow passive geographic and sector weightings” is “esoteric”? It is esoteric because it has a lower R², a higher tracking error and most important of all any exposure doesn’t make sense for most mums or dads with limited funds simply because, as the theory tells us, the least risky portfolio is the market portfolio. Overlay that with higher costs and it doesn’t look compelling. The third reason to avoid this sort of thing is because most fund managers can only get the initial issue of stock away when the sector is popular and that pretty well guarantees underperformance in the medium term. Water may have been different but that’s what normally happens.
I regularly have these sorts of “discussions” with authorised financial advisors which really does illustrate the fact that advisors are happy to ignore the theory and will only buy CPD that doesn’t threaten their business model.
Having said that if you were of the opinion that you were one of the few people that appreciated the significance of “water” you might allocate 5% of a clients’ portfolio to a water fund. Anything else in my view would not be putting the clients’ interest first.
Regards
Brent
Apologies in advance for any typos (bit short on proof reading time)
My latest view is that NZ's tax rules for individuals when it comes to global shares are way too complex, and the IRD, MBIE and FMA need to get together to simplify the tax rules for global shares (for individuals). While Dr Michael Cullen did a great job when he created KiwiSaver, PIE and even the FDR tax rules - he through a twist into all of this by creating a massive tax benefit which in turn incentivises many individuals to use FIF funds, even though the specific FIF funds might be full of tax leakage.
Accordingly, I think Cullen's FIF rules for individuals make it too technically difficult to actually figure out whether a PIE of FIF is best - as this becomes a function of an individual's specific circumstances. Accordingly, please read the following comments as a reflection of how crazy the current rules are. As I have noted at the end, fixing this issue is pretty easy for the IRD and law makers.
For house keeping, under point 2 - after "But wait, there is more" it is easy to calculate the withholding tax slippage you are referring to, as this is typically 15% (being the standard rate of withholding tax around the world) multiplied by the dividend yield on the portfolio.
Where the world gets crazy is that the FIF tax rules provide massive benefits to many/most individuals based on their circumstances. Those on high tax rates who are saving lots into global shares typically benefit the most from using FIF. The scale of this benefit can be massive. I am actually little surprised that your analysis didn't include comment on this - but this then adds weight to my argument that al this is way too complex, which is why it needs some focus from the regulatory groups like the IRD, MBIE and FMA. My view is that things like robo advice simply won't work under the current take rules for global shares.
To demonstrate this, if we assume that an investor has a tax rate of 33% for their FIF investments, and a PIR of 28% for their PIE funds, then when their global share returns are over 5%, they would pay 1.65% tax on their FIF fund investment (being 33% multiplied by the 5% FDR rate), and 1.40% for their PIE fund investments (being 28% multiplied by the 5% FDR rate). In this case the investor in the PIE is 0.25% better off.
However, there are various scenarios where the PIE investor is worse off. For example, global share PIE funds always pay the FDR tax, even when returns are negative. In contrast an individual in a FIF fund can choose to move from the FDR methodology, and use what is called the CV methodology for calculating their tax (provided they use the same methodology for all their FIF investments in any given year). This means that in a year where global shares fell, which does happen from time to time, the investor in the FIF fund pays no tax if they use the CV method. Accordingly, this is a saving of 1.40% relative to the PIE in these negative return years.
Also, investors in FIF funds can elect to pay tax based on the value of their investments at 1 April. This is important to think about, as it means that contributions and gains made between 2 April and 31 March of the following tax year aren’t taxed (which is quite incredible - and is more significant than it first appears when set out in print like it is here). This results in another tax saving for FIF investors relative to using a global share PIE – reflecting that PIEs typically calculate tax each business day (meaning all contributions and gains made during the year are taxed).
The combination of these two factors is what matters - and is what needs modelling out in order to understand why this is big. The tax advantage/incentive that swings to FIF funds becomes big, because of the weird combination that individuals can skip paying FDR tax in negative return years, and also miss out on paying tax on tax on gains and contributions in positive years.
This means that the analysis of which is best (PIE or FIF) actually initially needs to be been done looking at it purely from each individual's position. You will find that the profile of the individual is what drives what type of fund they should be looking at. Some people will be better in FIF funds (being those on high tax rates and making big contributions), while others should stay using PIEs for global shares.
It is only when this is figured out that one needs to get down to looking at the characteristics of the different funds - as then (if the answer for the individual is FIF), thought needs to be given as to whether the tax slippage within a specific FIF outweighs the tax benefits that the individual gets from using FIF funds. This further is complicated further by the offshore fund provider being under no obligation to actually disclose what tax slippage occurs for Kiwi investors (even if they have specifically structured their fund under rules like Mutual Recognition to be sold to NZ investors).
Key point is that this is all too hard. The fact that your analysis missed this simply serves to highlight my point.
And finally - it would be easily fixed. All the IRD needs to do is make sure individuals are taxed exactly the same as PIE funds are. They should pay FDR tax even when returns are negative, and also pay tax on contributions and gains made through the year.
Regards
Jamie
- In an investment sense the term “esoteric” normally refers to alternative / unconventional assets and structures. Investing in farmland collectively through a LP is esoteric. I guess everyone can have their own definition - but I wouldn’t put global equity funds in that category simply because they hold 50-100 stocks – it would likely be news to the managers of Magellan Global, Platinum Global and Hunter Hall Global that they are esoteric investments!
- You talk about the mispricing of stocks in an IPO, which I agree can be particularly true where private equity is the promoter of the float. For the record our Water Fund has never bought any shares through an IPO.
- We don’t claim to be one of the few people to appreciate the significance of water (the significance has been recognised for thousands of years!). We have, however, offered a unique access to this investment theme for the last 7 years.
- I agree that if you think investing in water stocks is a good idea it should only be a small part of a portfolio. That’s exactly right – it’s a satellite fund not a single global equity solution.
Regards, John
Thanks Brent – again there’s plenty to follow up on from your comments… but firstly I want to take issue with these ongoing throwaway lines such as “…will only buy CPD that doesn’t threaten their business model...” inferring that the advice industry is somehow corrupt. Brent – just because an industry participant has a differing view to yours doesn’t mean that their intentions are not to put the client’s interest first. Equally, it can be argued that this continued focus on low management fees permits a complacent segment of the advisory community to preserve their own margins whilst delivering mediocrity to their clients.
Your first paragraph makes [again] some huge statements about the active versus passive debate. Part of the value proposition for advisors is to filter out the huge number of underperforming investments, to determine which investment solutions are appropriate for the client and the investment conditions. There are still plenty of active Managers who continue to add significant value… and plenty of advisors who continue to monitor, research and identify these.
Coming back to the ongoing debate around fees: Fees aren’t the sole metric to judge an investment solution by, nor are active versus passive Managers. In fact, Managed Funds (irrespective of their structure) are not the sole solution for portfolio construction. The answer is to seek investment solutions that are appropriate for the investor and relevant in the investment conditions. Sadly, the weight of money transferring from active to passive globally doesn’t necessarily reflect this logic.
Keep fighting the good fight Brent – as you provide plenty of useful fodder to set the record straight.
The discussion has side tracked somewhat from the issue of your analysis, which I believe is the cost of owning off-shore shares via various different securities. We did this analysis a while back and our conclusions were similar to yours except for one big issue. As I understand, a PIE pays the FDR tax every year whereas individuals can choose between Comparative Value (CV) and FDR. This of course means in a down market an individual can have no tax to pay and the PIE still pays tax using FDR.
I remember when the FIF regime first came in, three out of the first five years using CV there was no tax to pay! Difficult to factor this in to your analysis, as is the different custodial rates. A rate of 0.2% looks pretty fine when compared to a banks private wealth levy but as doomben points out in a platform you would pay the same for both.
By the way our conclusion was that PIE’s are good for small amounts up to $20,000 but after that better to own the ETF. And yes, I agree with Brent that no CPD credits earned for doing the best for your client here.
Firstly, Antony. I feel you are looking at this issue from the point of view of improving the competitiveness of PIE funds rather than making the tax regime fair. The easiest way of fixing the FDR regime is by throwing it in the rubbish bin and tax income from global equities the same way as we tax income from every other asset. One unexpected outcome of FDR is to encourage NZ’ers to buy residential property.
Hi John, the difference between Platinum Global and a Water fund is that Platinum Global invests over different sectors and a Water fund does not. Semantics aside most people with limited funds should not have more than 5% of their international equity portfolio in individual niche sectors. When I talked about mispricing of stocks in an IPO I meant that new issues of specialist investment trusts and managed funds can only be successful when the sector is popular and that is the kiss of death in the medium term anyway. I have been there and done that in Indian stocks and commodities and a few other sectors before I realised how stupid I was.
Lastly, Pragmatic. My views can of course be wrong but unfortunately they aren’t just my views. They are the views of uncorrupted, uncompromised academics around the world and they are the rules and practices embraced by pension funds and sovereign wealth funds like the NZ Super Fund. I wish I could claim to have thought of them myself but I am just reciting what I was taught when I completed the Society of Investment Analysts course back in 1986. And yes fees are not the sole metric but in the absence of any other reliable fact they are a great place to start.
As to your last comment - thanks to you as well.
Regards
Brent
In saying that you have in fact piqued my interest in water funds and I could be interested in your fund for a small portion of my portfolio. It fits with my semi environmental/ethical views on the world's resources. Water is a scarce and valuable resource to the world these days and wars may be fought in the future of the control of this resource. We only have to look at the discussion at present over the NZ govt allowing pretty much free reign to NZ water to overseas interests. But I digress. I will certainly have a look further into the water funds space. BTW I'm not a financial adviser :-)
Can you (or any other commenter) please explain this comment around FIR tax:
“ investors in FIF funds can elect to pay tax based on the value of their investments at 1 April...contributions and gains made between 2 April and 31 March of the following tax year aren’t taxed”
Wouldn’t these contributions and gains to the value of your portfolio just be picked up in the following year’s 1st April total value, ans therefore be taxable?
What am I not getting?
Thanks!
Good article, thanks. Just out of curiosity, why didn't you include brokerage and forex costs in your analysis of overall costs for NZ investors buying US ETFs?
Our analysis shows that for US stocks, one well known NZ online broker charges around 0.60% each way in brokerage, plus 0.25% p.a. custody, plus up to 1.5% forex spread each way, plus $5 per month admin fee, plus $100 fee to release a security from custody.
So it's not exactly cheap to buy or sell a US ETF when you can invest in an equivalent NZ listed ETF or unlisted fund which includes most or all of the above fees, even if the headline management fee is higher.
Sign In to add your comment
|
|
Printable version |
|
Email to a friend |


Very interesting but the example of an esoteric fund like water is something few retail investors would/should own. I would rather see the analysis on global or whole of market ETFs or such like which retail investors should own. I suspect the figures would look much less interesting for investors.