

Time to get climbing?
Tuesday, April 17th 2018, 9:31AM
by Jamie Young

We recently came across the chart below, which by anyone’s standard gives a truly long-term view on interest rates.
It was put together by the Reserve Bank of England around 2014 and attempts to discover the long term “risk-free” rate by taking the government bond rates from the government considered to be the holding the reserve currency of the time.
The global financial powers of the time are noted as different colours in the chart.
The chart highlights just how extreme the ride has been over the last 80 or 90 years. Rates have risen slightly since 2015 so the title of chart is not quite correct anymore.
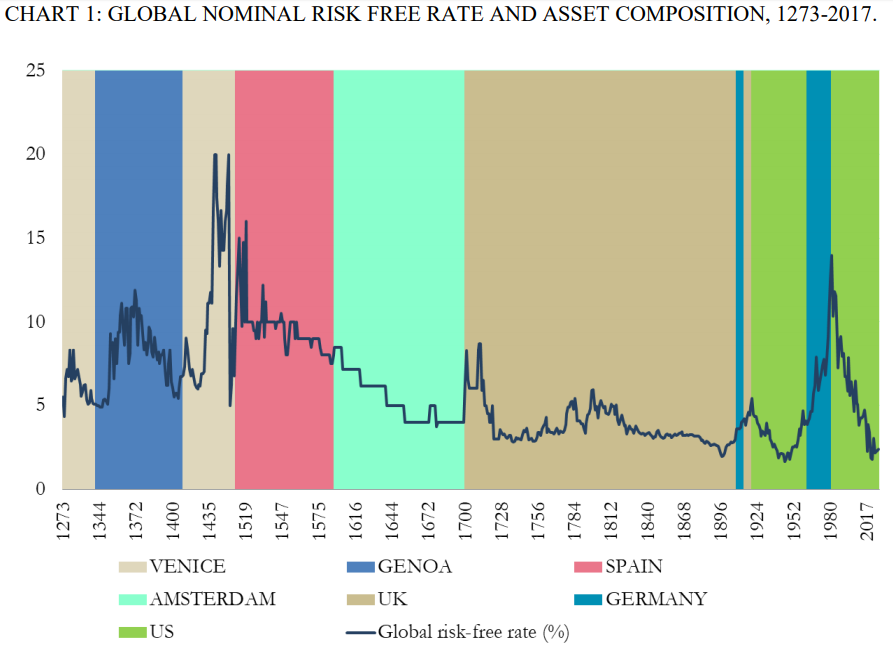
Source: Staff Working Paper No. 686 Eight centuries of the risk-free rate: bond market reversals from the Venetians to the ‘VaR shock’ Paul Schmelzing(1)
The period from 1930 to 1980 reminds us of the French cycling term “hors catégorie”, which is used to designate those climbs that are beyond categorisation.
It was originally used for mountain roads where cars were not expected to be able to pass. Presumably, it would have felt as painful for bond investors as cyclists through this 50-year period.
The benefit of slogging away for that length of time though, is that when you eventually turn at the top you get to freewheel down the other side for a long time. And indeed, the last thirty years for bond investors has been a comfortable ride of attractive yields plus strong capital gains.
However, we might have hit the valley floor after the GFC and, as any watcher of the Tour de France will know, while you can regroup and ride along the flats for quite some time at some point you must take one of those passes and start climbing again.
The chart below shows the US 10-year rate over the last 30 years, which has just broken out of its long-term range.
Also notable, the Barclay’s Global Aggregate Index (which tracks government and corporate bonds) has posted losses for the first two months of 2018.
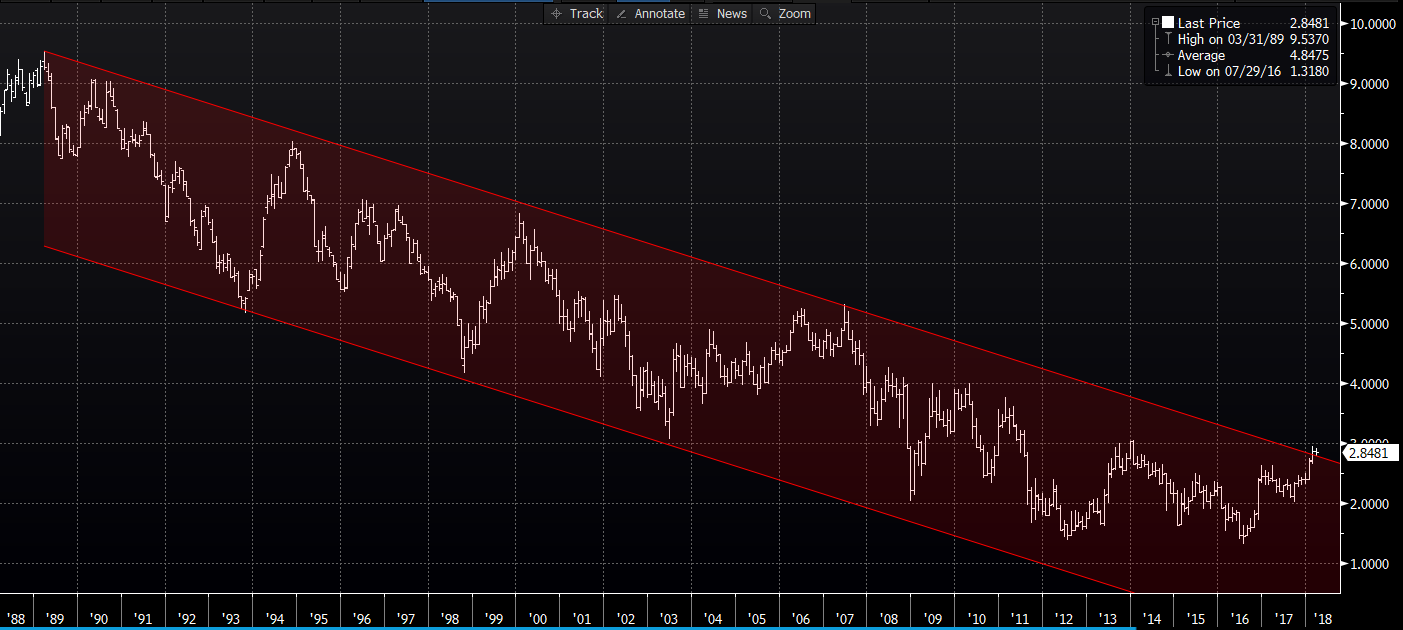
After such a long descent it will be interesting to see which investors in the peloton have the legs for the climb back up.
Jamie Young is a co-founder of Castle Point Funds Management.
| « The Code – issues for advisers (Part One) | Investment horizon: The changing face of the New Zealand credit market » |
Special Offers
Comments from our readers
No comments yet
Sign In to add your comment
|
|
Printable version |
|
Email to a friend |

