Economists give their views on house prices
REINZ released its latest data on the housing market today. Here we summarise what three economists think is happening in the housing market.
Thursday, October 14th 2010, 12:00AM
by The Landlord
ASB expectes prices to soften
The data was affected by the Canterbury earthquake - house sales in the Canterbury/Westland region dropped 36% from the previous month, which is unsurprising, given the disruption and damage following the 4 September earthquake.
Looking at the rest of the country, the nationwide experience was similar to the preceding months of 2010 - that is low turnover, but relatively steady prices.
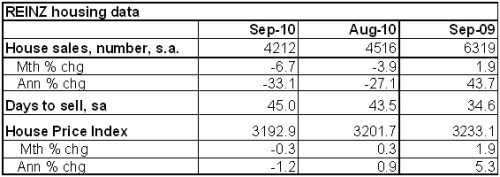
Nationwide days to sell extended to 45 days from 44 in August (SA). Days taken to sell in Canterbury did not extend by much (from 38 to 40 days). Our ex Canterbury Days to sell estimate held steady at a seasonally adjusted 47 days. Days to sell extended in Auckland but shortened in Wellington in September. By this measure, the market remains tipped in favour of buyers, with days to sell comfortably above the long-run average of 38 days.
Turnover was low, at 4251 houses sold (SA). This is down 29.1% on year ago levels, and down 6% on last month. Stripping out Canterbury, turnover picked up in raw terms, but not to the extent we would expect given the seasonal pick-up at this time of year. Our ex-Canterbury turnover calculation shows turnover easing 6% in seasonally adjusted terms - the same sort of drop as the seasonally adjusted nationwide measure.
Until recently low turnover has been matched by relatively low listings. This has helped support prices. Our inventory measure shows that based on current listings and monthly turnover, there is a steady extension in the months to sell total listings over 2010. This measure (which excludes Canterbury) has extended to 13.9 months, up from last month's 12.8 months (SA). This figure now getting quite high - and well off the trough of 8 months of inventory at the end of last winter.
The nationwide median house price remained steady at $350,000. Our preferred measure, the REINZ Stratified Median House Price eased 0.3%, to be down 1.3% on a year ago. Auckland house prices remained solid - up 2.7% in the month, and 2.3% higher on year-ago levels. In contrast, Wellington prices eased 2.1% in the month to be down 0.3% on year ago levels. Prices in Christchurch dipped 3.3% and are down 5.3% on year ago levels, according to the latest month's stratified median. Given the massive drop in turnover, we are treating price data for the region with caution. However, for the rest of the South Island, the stratified median price also dropped, and was down 1.3% in the month. This suggests some broader softness, and is the third month of declines for prices in the South Island. North Island prices for areas outside of Auckland and Wellington were even weaker, and fell 2.1% in the month, to be down 1.1% on year ago levels.
Sales figures will likely be significantly impacted by the Canterbury earthquake over the coming months.
We expect house prices nationwide to soften, and post small year-on-year declines of around 2%. However, behind the nationwide decline we expect a range of experiences, from modest price gains in cities where the market remains tight, through to declines in areas where the property fundamentals remain weak. Today's data is consistent with this view.
Chris Tennent-Brown, ASB
Westpac: The housing market continues to weaken
House sales were down sharply in September, although that partly reflects the impact of the Canterbury earthquake. Fear of buying a damaged property, combined with weeks of powerful aftershocks, was a roadblock to house sales, which were 62% lower than last September in Christchurch City. By our estimates, excluding the effect of earthquake there would have been a 2.7% decline in national house sales.
The house price index was down 0.3% this month, to be 1.2% lower than a year ago and 5.6% below the November 2007 peak. Again, the earthquake may have polluted the national figures. The Christchurch house price index was down 3.3% in the month, compared to +2.7% in Auckland, -2.1% in Wellington, -1.6% in the rest of the North Island, and -0.8% in the South Island ex Christchurch.
Days to sell lengthened to 45 in seasonally adjusted terms.
Outlook
The market is currently very weak, but we are now anticipating some improvement at the tail end of this year or early next year. Over the past few months mortgage rates have fallen substantially, and net migration has surged. In time, these changes will show up first as stronger sales, and eventually in stronger price dynamics. But don't get too excited. In the current environment we might expect such changes will cause the market to change from gently falling to flat prices, whereas last decade a change in fundamentals would have meant the difference between +8% and +12% annual house price inflation.
Market implications
Abstracting from the earthquake, these data are indicative of a weak housing market. However, since the RBNZ and the market are now fully primed for declining house prices, there are no market or monetary policy implications.

JP Morgan:Recovery stalled
The fall in house prices in September added to building evidence that the recovery underway in New Zealand has all but stalled. Property demand has weakened significantly in recent months amid higher interest rates, easing migration flows, and changes to the way property is taxed (announced in May). The relatively new tax measures prevent property investors from offsetting their losses against income and other taxes, making investing in property much less appealing than it was before. Property sales have suffered as a result, with only 4,323 homes reportedly sold last month, close to a decade low.
The REINZ reported that the median house price in New Zealand fell 0.3% over the month of September (J.P. Morgan: -1.0%, no consensus). The median price for a house was NZ$350,000, which meant that annual house price growth was flat, having risen a mere 0.9%oya in the previous month.
With borrowing for housing rising just 2.4%oya in August, marking the slowest pace on record since 1999, property demand will remain subdued, particularly given that New Zealanders have adopted a more cautious approach to spending. Indeed, with households realigning their spending patterns and consolidating their balance sheets, which have historically been too leveraged to housing debt, demand for property will continue to ebb. Already, it is taking, on average, 43 days to sell a property in New Zealand, although in coming months it likely will take much longer. Further, given the backlog of unsold property sitting on the market, we expect that house prices will continue to trek lower throughout the remainder of the year.
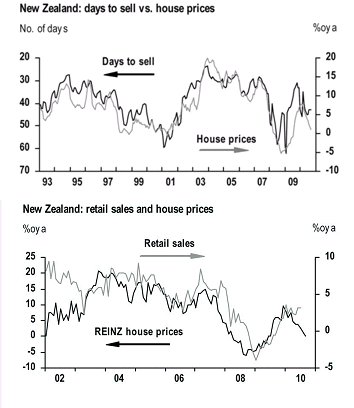
Attention now turns to the August retail sales data to be released in a short while. As the second chart indicates, the downturn in housing market activity will further encourage New Zealanders to tighten their purse strings. We expect that retail sales were flat in August, with the significant discounting among retailers, in particular, weighing down retail sales in value terms.

| « Sales and median price fall in December | No spring in property markets step » |
Special Offers
Commenting is closed
| Printable version | Email to a friend |


