Uncanny prediction for house prices
Wednesday, October 6th 2010, 10:25AM  10 Comments
 We’re into the next round of monthly house sales data with Barfoot and Thompson, yesterday, releasing stats on sales in Auckland.
The story seems to have a recurring theme to it. Prices good but volumes low.
I’ve been looking at the big question about where house prices maybe heading and was sent a set of slides from a presentation ANZ did recently. It has lots of regular themes in it, but also a couple of graphs which grabbed my attention.
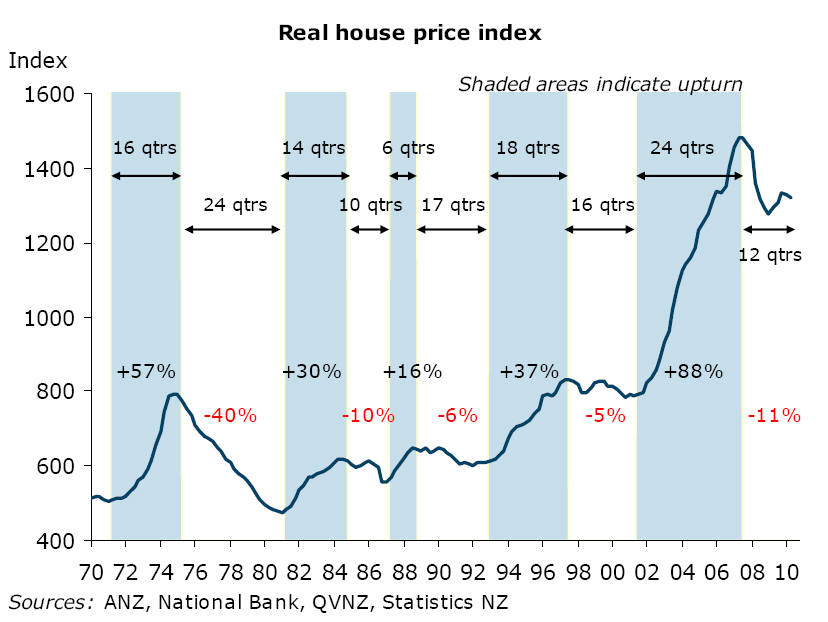
The first is one we used a year ago which show house prices through their peaks. (Click on image below to see it).
 The most recent housing boom lasted for 24 quarters and prices rose something like 80%-plus. The idea is that the bust time would be quite long and house prices would fall 20-25% from their peak.
At the time this graph was put together the falls had run for 12 quarters yet prices were down only 11%.
What’s fascinating is after they came off their peak they bounced again.
The message is that it seems that the housing market just want crash.
The ANZ economist Khoon Goh, behind these slides has also written about the affordability issue in the latest issue of the
NZ Property Magazine. It’s worth reading, but in summary says although homes are becoming more affordable they are still on the expensive side. The way this is going to close up is that incomes will rise rather than prices come down.
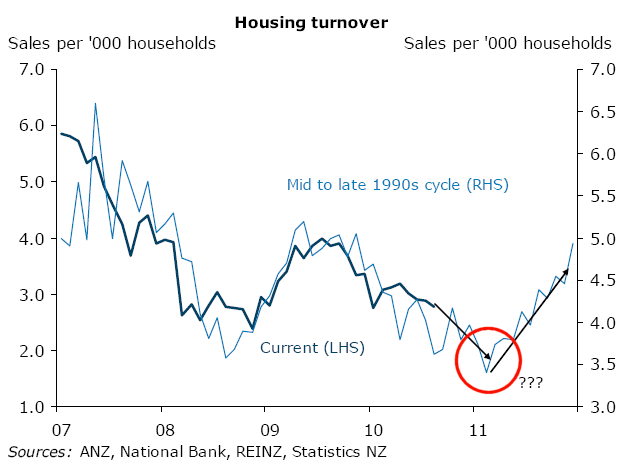
 The second graph is the one at the end of the presentation where two housing cycles were compared. The results are uncanny at how closely correlated they are. Click on the image to the left and see a bigger version of the graph.
I’ve put a red circle in to show the current time point. Assuming the trend continues we are likely to see house prices come back some more then rally and do so quite strongly.
The question is will this really happen?
| « What's best? Renting or buying | It's not the banks with the housing stockpile » |
Special Offers
Comments from our readers
On 7 October 2010 at 9:59 am Murray Chong said:
Bricks and mortar investing is always a great investment option.
There are always highs and lows but when you combine the leveraging on property as well as the rental returns it works out to be a great all round investment.
I believe everyone with a 40hour job can afford their own home (thanks to Kiwisaver) and the average person that has owned a property for ten years can afford a rental investment property as well.
All this is easy and rewarding investing.
On 7 October 2010 at 8:06 pm Stephen said:
One other conclusion that can be drawn is that the boom of 1974 and the subsequent bust took around 20 years before there was a recovery. Also the premise that the affordability gap will be closed by rising incomes would suggest that we are in for a protracted time of flat prices as incomes are unlikely to rise dramatically in the near term.
Net migration is going to be the key to increasing demand, yet even this may not increase prices, as houses in NZ are relatively highly priced compared to countries that many of our migrants arrive from.
On 8 October 2010 at 9:20 am Miles Corporate Lawyer said:
What that graph tells me is that there are another 12 quarters of fall to go so likely a comparable drop to the 1970s. That was minus 40% off a 57% gain. So this time, off the back of an 88% gain, expect something like a 50% fall yet to come. The real issue was noted. Eventually house prices depend on the economy which gives rise to incomes. The economy is down or stagnant and so are incomes. Ask the tax dept which showed a 12% drop in paye tax and a whopping 25% drop in self employed tax. The latter is where the wealth usually hides which supports the house prices. So will the house prices correct to an affordable 3 times salary? Given the state of the world economy, that is more likely than them bucking the graph indicators from the 1970s. On 8 October 2010 at 11:01 am Miles Corporate Lawyer said:
Another thought is that the median, average and similar whole of nz index of house prices show gains because of market segment issues. The lower priced house owners were forced out long ago. Now it is the turn for those higher priced higher mortgaged owners. So it is this segment which is falsely showing up as higher prices. A Christchurch quarter report well before the quake but withinthe last year showed a 20% gain . That was clearly driven by a market segment. Be cautious about total price indices. They hide more than they show. But that could mean a precipitous drop in total house prices after those higher priced houses have been all sold. Likely to take another year. Then there may be a huge drop as the market settles back to 'normal' market segments. Strange times. Read between the lines. On 8 October 2010 at 4:03 pm Miles H-R said:
What that graph tells me is that there are another 12 quarters of fall to go so likely a comparable drop to the 1970s. That was minus 40% off a 57% gain. So this time, off the back of an 88% gain, expect something like a 50% fall yet to come.
The real issue was noted. Eventually house prices depend on the economy which gives rise to incomes. The economy is down or stagnant and so are incomes. Ask the tax dept which showed a 12% drop in paye tax and a whopping 25% drop in self employed tax. The latter is where the wealth usually hides which supports the house prices. So will the house prices correct to an affordable 3 times salary? Given the state of the world economy, that is more likely than them bucking the graph indicators from the 1970s.
On 10 October 2010 at 11:51 am Jay said:
I have been hearing quite a few stories about houses being sold well under valuation at bargain prices. As these stories get around buyers will not settle for anything less than a bargain with plenty of equity. There are so many people who bought at the peak in 2007 and as we speak are holding on and praying that prices will rise. The only thing that will rise though is interest rates. With record low interest rates and record high mortgagee sales the writing is on the wall(in my opinion). Buyers aren't silly, for want of a better analogy I think buyers are circling the herd at present and are happy to pick off weak as they fall down. On 11 October 2010 at 8:47 am Arty said:
Interesting data. I think price averages are holding in some areas - North Shore AK is one, but due to quality of housing stock only. Leaky homes - plaster houses are very hard to sell, placing price presure on the few that are not.
In the last couple of months I brought 2 properties, one at less than half the current CV and one at 30% less, both well located. Smart buyers are not jumping in, no matter the area.
The difficulty with a correction is the cost, all owners take a loss. If it is a paper loss not so bad, but if the loss is real the affect is dramatic. The lenders have held the market up. I wonder how long the banks will accept such a high risk with such low incomes,rapidly raising fixed cost's and future income growth unlikely.
On 23 November 2010 at 4:21 pm Sam said:
I agree Jay, buyers are taking their time and doing a LOT more homework than the buyers of just a few years ago. Which can't be a bad thing! It would seem many people did more research on buying a new fridge than on their next investment property. Can't see prices rising in the next 18 months, turnover however may increase if recent news on home affordability is anything to go by. On 27 December 2010 at 7:28 pm bArt said:
Comments so far seem to have factors all variables except inflation. Not normal inflation caused by rising wages but the flow-on effects from the Federal Reserve in the U.S.
60 Billion has been printed and is being loaned into existence on a as needed basis. That is as it's needed to stimulate the economy. Once the economy is stimulated inflation is the unwanted by-product. NZ has done well to date by not simply printing/borrowing more so we may not be so badly off in the longer run.
Commenting is closed
| Printable version | Email to a friend |


The two lines have had their scales manipulated to arrange a match, since we only have a short period of the comparison, that suggests further manipulation by choice of time period. The scale change however may hide that the current price changes are more severe and dramatic than the 90's period.
With such a different reaction to the environment, that could be blamed on the cause of the cycle drop in sales - ie the financial market, but I believe the magnitude of the change, and hence the scale, is due to the major differences in the markets during these times. In 1990, property was not promoted on the internet, it is now the main method of promotion, in fact your site is the major player.
Better information enables a quicker response, ie the feedback loop is shorter and has more capacity, enabling a better informed market to react sooner and potentially with greater impact, hence the timing of the next change could be driven by information, not history.