

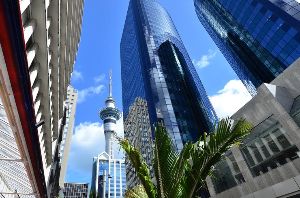
Shadow commercial space emerges
As office tenants reassess their existing and future space needs amid changing expectations around what workplace environments should look like, and adjusted bottom-line budget realities, there has been some notable corresponding changes in office property market fundamentals.
Sunday, May 9th 2021, 1:00PM
Shadow space is being released to the market as tenants become pragmatic about their space requirements and look to reduce occupancy costs, a new Bayleys' report shows.
By on-leasing some of their office property, a tenant can recover a portion of leasing outgoings without the inconvenience and associated costs of exiting a lease or relocating to smaller premises.
In the face of changing work models – boosted by improvements in technology and reflecting global best practice – large tracts of office space consolidated in one central location are increasingly being reviewed, says the report.
Some tenants are adopting a core + flex model with a more condensed centralised hub supplemented with satellite space elsewhere. Others are actively looking to sub-lease excess space to allow business continuity.
When combined with recently-completed office space and a relatively-large pipeline of supply soon to come to the market, this shadow space is putting downward pressure on rents.
Colliers International research shows average net face rents are holding stable.
With prime net face rents sitting at $512 per m² and average secondary net face rents at $295 per m². Completion of new builds are expected to push prime face rents to about $900 per m² and higher in the coming year, but are likely to come heavily incentivised.
The emergent sub-lease space in the Auckland CBD market, says Bayleys is coming from various business sectors – particularly those that have been able to quickly and seamlessly switch to more remote working models, or those that have faced significant restructuring and the subsequent reduced headcount.
Some bigger businesses are taking a long-lens view on space requirements and are yet to decide whether to downscale on pre-Covid office space commitments. While many smaller tenants are also tentatively riding the wave by embracing shorter-term solutions before making any hard-and-fast longer-term commitments, according to the report.
Also notable in this evolving shadow space narrative is more proactive communication between landlord and tenant as workable solutions are sought for all parties.
When combined with recently-completed office space and a relatively-large pipeline of supply soon to come to the market, this shadow space is putting downward pressure on rents.
Suburban office market
The impact of changing working styles has meant many companies are also looking to a core + flex model of working. This can include having smaller satellite offices in multiple locations or a proportion of staff working from home.
As a result this leads to shorter commute times for workers and reduces the number of people in the office at once.
The industry’s hardest hit in the fringe office markets include the tourism and the international education sectors.
The suburban office space also has an abundance of small-medium enterprises who may have had to close due to the pandemic or have adopted temporary work from home policies. The resulting combination has contributed to increased vacancy.
Secondary grade buildings have been the hardest hit by the impacts of Covid-19 and vacancy rates have risen, while the impact on prime grade buildings has been softer, showing a flight to quality. There has been a lower supply of C and D-grade buildings as many have been converted or redeveloped to residential apartments.
Surprisingly, stock in the Auckland metropolitan office sector over the past nine years has barely increased.
Total stock in 2011 was 779,216m² and in 2020 this was 816,845m². This is only an increase of 4.83% over nine years, reflective of the amount of residential apartment development being undertaken and a lot of office stock being repurposed or redeveloped into residential living.
Investment market
Agents are reporting secondary grade office space is suffering more than the prime market.
Lower quality buildings tend to be more undesirable for tenants and command lower rents and a higher yield, but on the other side higher buildings in the city fringe are performing better. These are the buildings with higher amenities, better locations and better quality space commanding higher rents and lower yields.
Funding by banks has been tough on lower quality buildings which do not have a long lease, or with other risks such as a low New Building Standard grade or asbestos.
Total returns (income and capital) in the non-CBD office sector have averaged 8.3% over the past five years. Income returns have helped keep total returns on the positive side as capital returns tracked into negative territory.
Average net face rents are holding stable, with prime net face rents currently sitting at $512 per m² and average secondary net face rents at $295 per m². Completion of new builds are expected to push prime face rents to circa $900 per m² and higher in the coming year, but are likely to come heavily incentivised.
| « Winners from new housing policies | Next generation of industrial property » |
Special Offers
Comments from our readers
No comments yet
Sign In to add your comment
|
|
Printable version |
|
Email to a friend |
