Non-bank lending moves slowly upwards
Statistics show that mortgage lending by non-bank institutions is inching upwards, but is still nowhere near the level it was before the Global Financial Crisis.
Thursday, April 21st 2022, 8:12AM
by Eric Frykberg
The figures match anecdotal information from the non-bank sector, which says it is getting more applications now than it has done for years.
The Reserve Bank (RBNZ) has statistics giving some credence to these comments, but indicate that growth is still a very slow process.
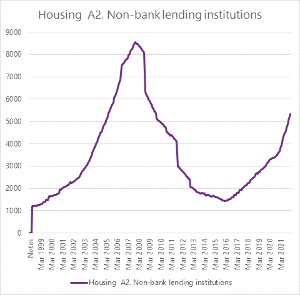
In February 2020, the non-bank sector had loans worth $3.2 billion. That was just 1.4% of total home loans at $280 billion.
Two years later, the non-bank sector had loans worth $5.3 billion, which was $1.6% of total loans of $334 billion.
When asked the Reserve Bank would not disclose which lenders were included in its non-bank lending data series.
The registered banks still had the lion's share of total home lending but were losing tiny slivers of market share, bit by bit.
The figures tie in with comments from non-bank leaders, who say their members are much busier now than previously.
Their umbrella body, the Financial Services Federation, says this higher workload might be due to the main banks having to limit low deposit loans to just 10% of total lending, while non-banks do not have to meet this requirement.
FSF chief executive Lyn McMorran says another reason might be the main banks tightening up on lending because of the Credit Contracts and Consumer Finance Act (CCCFA).
And there are general difficulties in the loan market that might lead to a scatter-gun approach by some brokers.
“Perhaps brokers are putting their deals to a wider range of lenders in the hope that one of them gets through,” McMorran said.
Despite the recent growth, non-bank mortgage lending still trails a long way behind what it was before the Global Financial Crisis.
The statistics show non-bank lending was $8.5 billion in February 2008, which was 5.4% of total home lending of $156 billion.
In subsequent years, non-bank lending fell to one fifth of that level, before slowly rebuilding.
In those years, several big finance companies collapsed, and the industry itself publicly admitted to a loss of public confidence.
But David Tripe, who's a professor at the school of economics and finance at Massey University, says the reality is more complex.
He favours a more simple explanation: many non-banks gained recognition as banks, taking their customers with them and pulling non-bank numbers down in the process.
This was especially so with the conversion of SBS, once the Southland Building Society, into a bank in 2008 , and a similar process with the Cooperative bank in 2011.
Then the Heartland Bank went the same way.
“I don't think it was a loss of confidence, it would be dangerously simplistic to say (the decline in volumes) was due to a loss of confidence,” Tripe said.
“The main problem for the non-banks sector would have been what was their role in a world where banks could do everything.
“That is certainly the question SBS and the Cooperative bank were asking.”
Non-banks generally charge a slightly higher interest rate than banks, though not by a big margin.
It is thought likely that people with a big income but few savings, possibly because they have just graduated into a high paying job, are not thought likely to be deterred by an extra one percentage point.
However their numbers are small.
| « RBNZ expresses concern over state spending | Vincent Capital adds a South Island BDM » |
Special Offers
Comments from our readers
No comments yet
Sign In to add your comment
|
|
Printable version |
|
Email to a friend |