NZ sharemarket trailed in Q2 but good longer term
The latest Melville Jessup Weaver Investment Survey* shows that New Zealand equities were behind global equities this quarter.
Monday, July 24th 2023, 1:22PM
by Andrea Malcolm

In each of the last three quarters the global equity markets rose 7% - despite high inflation, tight monetary policy, ongoing war between Russia and Ukraine and rising tensions between China and the west.
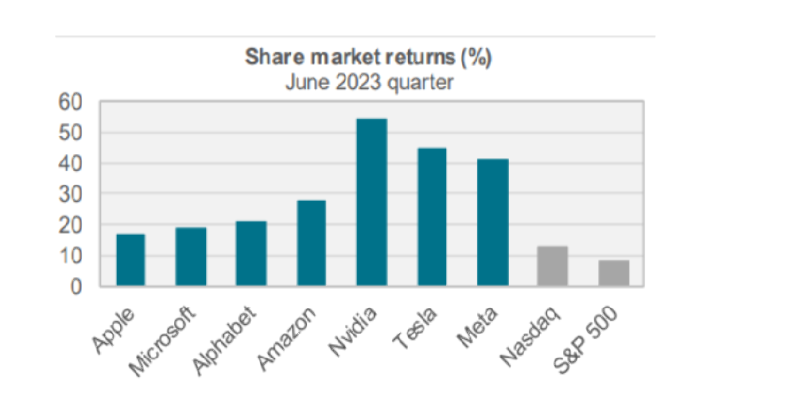
It has been a narrow rally - with the seven biggest US stocks (predominantly tech) accounting for most of the rise in the S&P 500 in the last quarter. This reflects the current mania for anything related to AI.
This dynamic has seen some indices become extraordinarily concentrated with the weight of the seven stocks shown below in the Nasdaq 100 reaching 55% to trigger a ‘special rebalancing’ this month.
Meanwhile, the headline S&P/NZX 50 Index rose 0.4%, about seven percentage points behind the global share market. The report notes that the S&P/NZX 50 Portfolio Index (which has the same constituents, but periodically re-weights the largest back down to a 5% maximum) did better than the headline index, returning 1.7% over the quarter. Australian equities had a better quarter – up 2.5% in NZ dollar terms – but they too trailed broader global equities.
But longer term, the New Zealand share market has been positive with a 10 year return of 11.5% per annum compared to 11.2% per annum for global shares (fully hedged). And the domestic return has come with volatility of 12.2% per annum compared to 15.4% per annum for global shares.
Since the New Zealand dollar is low today, relative to its ten year history, unhedged global shares have done better over this period. However, an unhedged global approach still had higher volatility than our share market. Completing the picture, over the decade, Australian shares have been relatively poor, with an annual return around 7% and the highest volatility amongst the indices covered in the report.
Author Ben Trollip says it could be argued that New Zealand’s relative success reflects the concentration of the NZX and a few stock specific success stories. “However, the more diversified S&P/NZX 50 Portfolio Index has returned 12.1% per annum and the S&P/NZX Mid Cap Index (which excludes the largest New Zealand stocks) 12.3% per annum. Both of these returns are well ahead of global shares (on a fully hedged basis).
A case for more NZX investment
“Add to this the greater success of active management in the New Zealand share market, and there begins to be a strong case to allocate to the sector. Indeed, the average KiwiSaver balanced fund in our survey has 13% in the domestic shares bucket, despite New Zealand being less than 1% of the MSCI World Index and less than 0.3% of global GDP.”
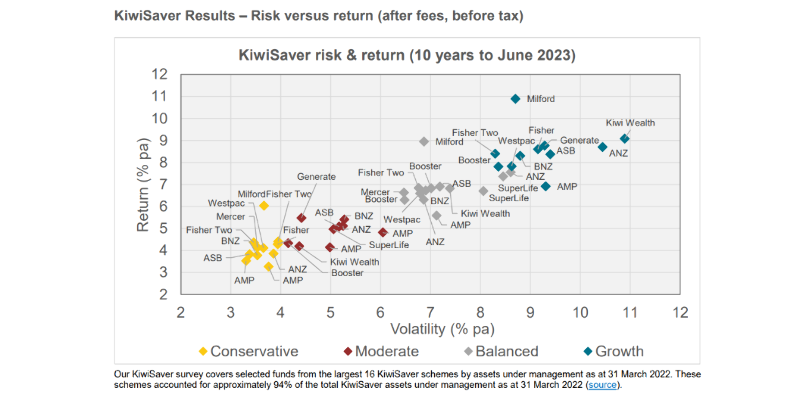
On the KiwiSaver front the survey looked at selected funds from the 16 largest KiwiSaver schemes by assets under management as at 31 March 2022. These schemes accounted for approximately 94% of the total KiwiSaver assets under management for the same period.
Median 2023 Q2 figures for growth funds was AUM was $1,739m which achieved a median 80% of the growth benchmark, and a 4.2% return for the quarter, compared to 11.2% for one year, 6/3% for five years and 8.4% for the 10 year period.
Median risk for KiwiSaver growth funds was 11.2% over the past five years and 9.2% for the decade. Generate led the quarter for performance at 6% while ANZ was bottom of the pack at 2.9%.
For balanced funds the medians were $936m AUM, 60% of the growth benchmark, and returns of 2.9% for the quarter, compared to 7.8% for one year, 4.9% for five years and 6.8% for the 10 year period. KiwiWealth Balanced performed best for the quarter with 4.1% returns and ANZ Balanced was bottom of the pack with a return of 1.6%. Median risk was 8.6% for the past five years and 78% for the decade.
In asset allocation Aus/NZ v global, the median for growth funds was 20.9% Aus/NZ shares versus 50.6% for global equities. Westpac had the heaviest weighting for Australasia at 25% v 43.2%. For balanced funds the medians for asset allocation were 13.3% Aus/NZ equities and 38.8% global equities.
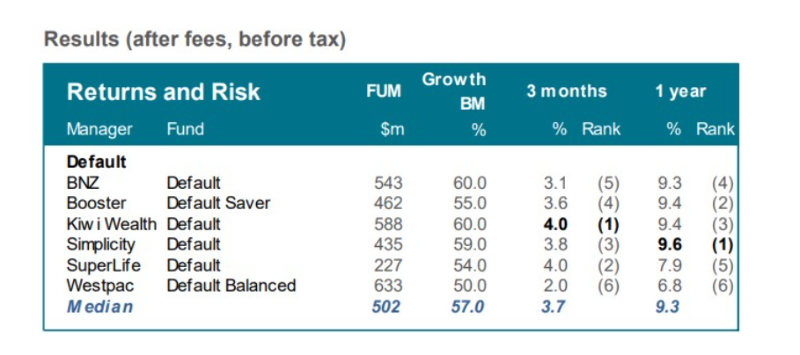
The six default providers launched new balanced default funds following the Government’s review in 2021. Default KiwiSaver members were moved from their conservative investment strategies to a balanced approach, with these funds targeting 50-60% in growth assets. In total, there was $2.9 billion invested in the default funds as at 30 June 2023.
| « Sharesies members looking bullish again | Tough times ahead for NZ economy: Nikko economist » |
Special Offers
Comments from our readers
No comments yet
Sign In to add your comment
|
|
Printable version |
|
Email to a friend |