

Taking tech's pulse and assessing its future
A year ago the technology bubble had burst and thousands of investors were looking at significant losses. Dot com companies were falling like flies, and then the big established names in the sector started reported major falls in earnings. Philip Macalister takes the pulse of the sector.
Wednesday, August 1st 2001, 3:28PM

By now investors who collectively lost millions of dollars when tech bubble burst will have wiped away the tears and will be reviewing what happened with dry, if somewhat sad, eyes.
What happened was a classic boom, bust cycle - something we have seen in New Zealand many times before. Perhaps the most recent one that had a similar resemblence, and sucked in many investors, was the great log price spike in the early to mid-1990s.
Back then log prices soared to the height of the forest canopy, then crashed down to the damp, dark forest floor. Since then they have essentially gone nowhere.
If you put graphs of the log price spike and the technology bubble together you'd struggle to know which was which.
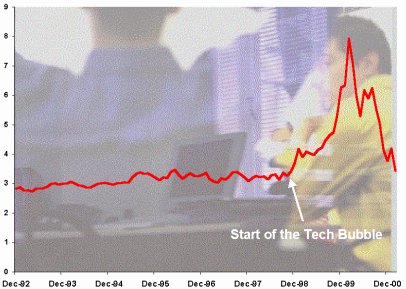
AMP Henderson investment strategist Paul Dyer says to get some perspective on what happened in the TMT (technology, media, telecommunications) sector, and where it may go, it's worth looking at the sector's share prices against broad market indices.
Dyer says from 1990 to 1998 the TMT sector moved in tandem with the market. Then in the two and a half year period from mid 1998 to March 2000 the TMT sector outperformed the market average by roughly three times. When the bubble burst TMT prices fell down to the market average and have once again started moving in tandem with it.
Lessons to be learnt
The stories behind the tech bubble provide some salient lessons for investors.
During the two and a half year period, companies with no business plan and no track record were floated on the stock exchanges around the world for inflated prices. These prices were further ballooned by speculative tech mania.
As economist Gareth Morgan points out all sorts of shonky accounting practices were used to justify prices including financing customers, reporting sales early, but expenses later, promoting sales by giving big customers cheap warrants. What's more investors where making valuations on pro-forma accounts which included these practices, rather than on the real ones.
Dyer says it's very hard to pinpoint where the tech market is at presently. It would appear "to be priced more or less right", he says.
Part of the trouble in determining where the market is at, is due to the fact that it is made up of many different industries and each of these are at different stages.
For instance, semi conductors seems to be hitting the bottom, but suppliers of telecommunication equipment still seem to have room to fall.
Dyer says it's not possible yet to rule out another big decline. If this happens the market is likely to undershoot.
He says this happened earlier this year when the Nasdaq, the barometer of the tech sector, hit the 1600 mark. Now it's trading in the early to mid 2000 point range.
Just to make things worse the whole sector has suffered from a global economic slowdown.
Shorter cycles
Dyer says one of the positives in the sector is that its cycle is short, much shorter than other industries such as forestry and steel.
Significant over capacity was built up during the tech boom and companies ended up sitting on major inventories which they couldn't sell for love or money.
In some industries it would take decades for a work out in inventory levels, but not with technology.
"The shelf life is comparatively short which helps the (sector's) indigestion," Dyer says.
He says there is no reason to treat the tech sector differently from any other sector: "It's just another part of the global sharemarket."
Some of the lessons that should have been learnt are that you can't throw traditional valuation methods out the window and investors need to focus on current earnings, not just projected future earnings.
Also the investors who get in late, or at the top, are the ones who suffer the most. Someone who was invested in tech before the bubble and are still in it afterwards would have recorded good performance, albeit hugely volatile. This is borne out by the long term track records of some of the established funds.
Likewise, it is essential that an investor has a diversified portfolio.
Dyer says while TMT will continue to move in tandem with the broader stock market there is almost no disputing that it will continue to grow faster than the rest of the economy.
| « Henderson's new tech managers outline their strategy | The nuts and bolts (or wire and solder) of tech funds » |
Special Offers
Commenting is closed
|
|
Printable version |
|
Email to a friend |
