

Harbour Asset Management Special Report
What does an elevated Equity Risk Premium mean for investing?
Monday, February 25th 2013, 11:49AM
by Harbour Asset Management
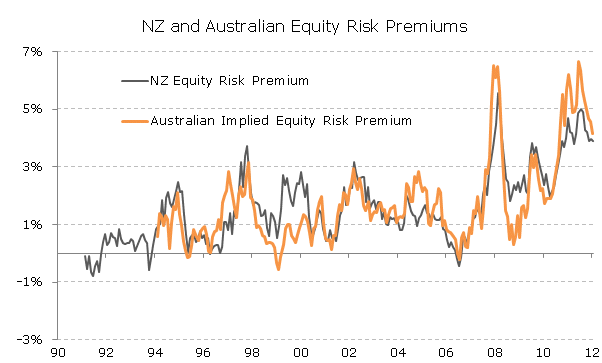
The Equity Risk Premium (ERP) across most equity markets has been elevated since 2010, but started to fall at the end of 2012. In our view, a further normalisation of the ERP would be associated with an out-performance of growth and cyclical stocks. It would also see lower correlation of returns between individual stocks, creating more opportunities for active managers. After the Australian equity market underperformed New Zealand in 2012, we see potential opportunities in Australian stocks moving into 2013, especially if the normalisation of the ERP continues.
Factors explaining the elevated equity risk premium
The ERP quantifies the additional rate of return investors need to compensate for the risk of investing in stocks versus bonds (typically the 10 year bond). ERP are often calculated by taking the forecast earnings yield for the equity market and deducting the 10 year bond yield, although there are many other derivations of this calculation. No matter which way you calculate them equity risk premium are high at the moment.
This begs the question why are investors not allocating more investment to stocks versus bonds? In the US over the last 10 years mutual fund investors have allocated more than 1 trillion dollars to bonds and sold more than 500bn in equities. Pension funds have lower allocations to equities in the US than on average over the past two decades.
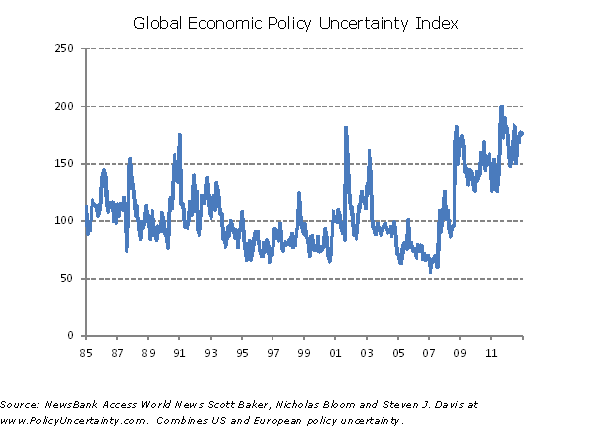
There is a high correlation across markets of equity risk premiums so we know that global factors are important. Investors have had to worry about the financial market crisis and deflation threats. Although there are several factors impacting on equity risk, probably number one is uncertainty. One key measure of uncertainty is the Economic Policy Uncertainty Index which has also been at elevated levels.
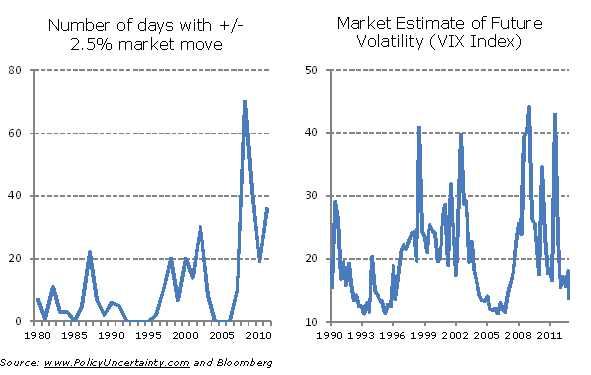
Market volatility itself is another factor contributing to high ERPs. Up until recently large market moves and the implied market forecast of volatility (VIX index) have been higher than normal. The VIX however, has fallen back recently, and specifically US equity market volatility has fallen.
The further move by Central Banks in the second half of 2012 to ease policy may be associated with the small fall we have seen to-date in equity risk premiums. However, lower interest rates and quantitative easing is likely to be keeping bond yields artificially low.
As a result low bond yields by themselves are likely to be a key part of the story explaining the high equity risk premium. To track how much of a factor this is we can look at models that seek to forecast an equilibrium bond yield. Using Goldman Sach’s model, US bonds are currently about 1% lower than a fair value estimate. Even adjusting the equity risk premium for the current deviation of US bonds from fair value, it is still evident that implied ERPs are at an elevated level. New Zealand and Australian ERPs are broadly similar after making this adjustment.
Key implications of the risk premium normalising
In normalising, the equity risk premium could fall a lot further across most equity markets. And a further normalisation in the equity risk premium is likely to be associated with a lower correlation of returns between stocks and out-performance of growth and cyclical stocks.
Correlations between stocks have been closely correlated with ERPs. When uncertainty on macro conditions or economic policy is high, stocks tend to move together, providing fewer opportunities for active management. We saw this in New Zealand and Australia in 2011 and 2012. By contrast, a lower equity risk premium tends to be associated with lower correlations between stocks and potentially better opportunities for active management.
A key feature of the Australian and New Zealand equity markets has been the extreme out-performance of defensive stocks over cyclical stocks. At one point since March 2010, defensives had out-performed cyclicals by over 35%. Since about August there has been some reversal, particularly in New Zealand.
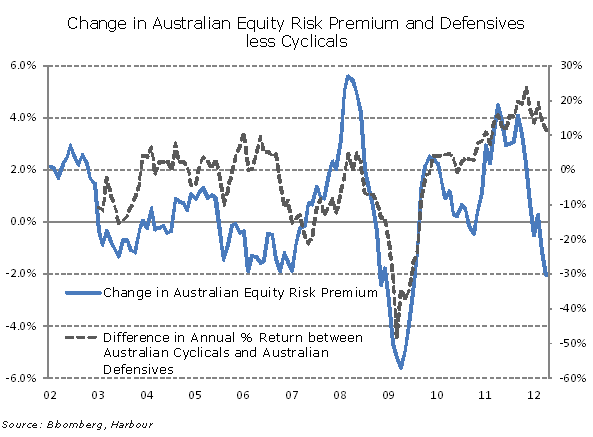
In the last five months of 2012, New Zealand cyclical stocks actually followed through on the fall in global and local ERPs, with stocks like Fletcher Building up significantly. In contrast in Australia, the fall in the ERP to-date has not seen the same extent of the New Zealand rally and so as we think about the implications of a further fall in ERPs globally we are looking to Australia for potential ideas to add to portfolios.
Harbour Asset Management is a New Zealand-based asset manager with extensive professional investment experience managing funds for government institutions, corporate superannuation funds, multi-nationals, charities, banks and insurance companies.
Important disclaimer information
| « The Brook Income Fund | AIA on a mission to break the cycle of under-insurance » |
Special Offers
Comments from our readers
No comments yet
Sign In to add your comment
|
|
Printable version |
|
Email to a friend |
