

Retirement decisions based on science not spin
KiwiSaver is rapidly proving as much of a bonanza for the marketing industry as it is for the wealth management industry
Monday, October 29th 2018, 8:00AM
by Paul van Wetering

Paul van Wetering
Some providers are spending seven figures annually to promote their various investment propositions. And as one would expect, if you let the ad executives loose, the key messages are, well… “loose”.
In addition to surveying clients to determine what they want out of KiwiSaver (see Good Returns article “What New Zealanders want from KiwiSaver may surprise you”), NZ Funds has been researching what really determines how much money a KiwiSaver member retires with. The answers are logical and intuitive to
long-term practitioners of financial advice, but will no doubt come as a shock to fans of Mad Men.
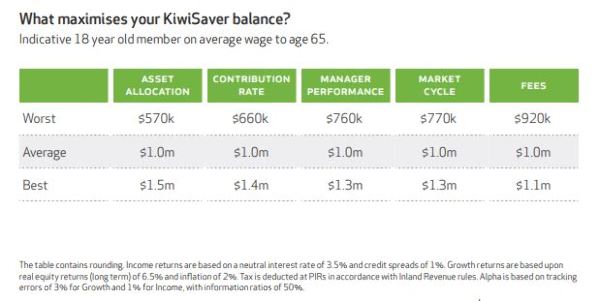
To answer the question: “What matters most in maximising KiwiSaver by retirement?” the NZ Funds Wealth Technology Team started with an 18 year old on the average full-time youth earnings of $38,324 per annum. The 18 year old’s earnings increase by 3% each year until they retire at age 65. In this way
they approximate the national average wage of $68,588 per annum (with adjustments for expected inflation). The impacts of different variables were measured, holding all other factors constant.
Asset allocation is the largest single determinant of retirement wealth (which will come as no surprise to financial advisers). Re-orientating a portfolio from 100% Income (default) to 100% Growth adds an additional $950,000 by retirement. Obviously, this comes with a higher level of volatility which may not match the investor’s risk appetite. Interestingly, even a transition from 100% Income (default) to a diversified portfolio of 40% Income and 60% Growth, increases the terminal value by $429,000, while a life cycle process can add as much as $931,000.
The second most powerful determinant of retirement wealth is a member’s contribution rate. Assuming an employer contribution of 3% before ESCT tax throughout, an increase in the employee’s contribution rate from 3% (the current statutory minimum) to 10% (the proposed statutory maximum from 1 April 2019, which together with the employer contribution approaches the Australian 2025 compulsory savings level of 12%), results in an additional $778,000 by retirement.
Manager performance can also meaningfully contribute to, or detract from, a client’s final retirement sum. Assuming performance bands of plus or minus 0.5% per annum for Income and plus or minus 1.5% per annum for Growth, for the entire 47-year period, manager performance either adds $347,000 or deducts $243,000.
The research shows that fees rank fourth. We took the difference between the lowest and highest fees charged by a Balanced fund (0.4% and 1.4%). The difference by retirement is $164,000. This is without doubt a considerable sum, but is meaningfully less than the value that can be added in the other ways that the team identified.
Some things are in neither the investor’s nor the manager’s hands, such as bull or bear markets. Fortunately, for most members, their time in KiwiSaver is long enough that they are likely to experience both over time and end up with the average. However, the order in which they come makes a meaningful difference. Those fortunate enough to enjoy a strong market (defined as neutral interest rates, credit spreads and real equity returns all 50% higher than average) from age 42 to retirement, after experiencing a weak market (defined as neutral interest rates, credit spreads and real equity returns all 50% lower than average) from age 18 to 41, accumulate $547,000 more than investors who experience a strong market between age 18 to 41 and a weak market thereafter.
Finally, there are a growing number of studies which seek to quantify the value an adviser can add.
NZ Funds measured the benefit of a personal financial plan and regular portfolio reviews by comparing two outcomes. The first, for an investor who at age 53 switches from Income (default) to Growth near the end of an expansion, and then panics at age 57 and switches from Growth to Income (default) after a period of investment market volatility. The second, for an advised client who stays the course with a diversified portfolio of 40% Income and 60% Growth. All other things being equal, the advised client retires $403,000 wealthier.
A surprising outcome of the research is that it shows investors are more in control of their retirement wealth, through asset allocation and their choice of savings rate, than the investment manager who determines fees and manager performance. And as with most things in life, fate also has a role to play in determining whether investors enjoy strong returns earlier or later in life.
The research also suggests that the resources deployed to build and maintain government funded sites, such as www.fundfinder.sorted.org.nz which predominately focuses on fees, would be better deployed illustrating the merits of growth-orientated investments over the long term, and encouraging New Zealanders to select
a higher contribution rate. The requirement from next year for all KiwiSaver Annual Member Statements to illustrate the merits of different savings rates to investors is a meaningful step in the right direction.
| « Advisers face challenging decade | SuperRatings ranks KiwiSaver schemes » |
Special Offers
Comments from our readers
No comments yet
Sign In to add your comment
|
|
Printable version |
|
Email to a friend |
