

Auckland loses ground
Ongoing house price strength in the regions sees Central Otago overtaking Auckland in the latest realestate.co.nz data.
Wednesday, February 3rd 2016, 10:00AM
by Miriam Bell
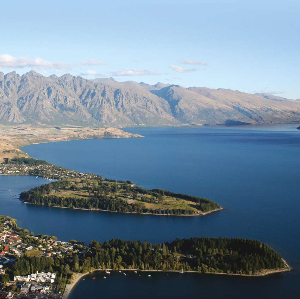
Queenstown
House prices in Central Otago are soaring as the region hit an average asking price of $861,723 in January 2016, according to the specialist property website.
This is the highest average asking price of any region – including Auckland - and is an increase of 4.5% from the region’s previous high of $824,394 set in December.
However, the region had 35% less new listings in January than it did at the same time last year.
Central Otago was not the only region to experience a record high in its average asking price in January.
Eight other regions hit new record highs in their average asking price in January.
Besides Central Otago, they were Wellington, Canterbury, Waikato, Taranaki, Coromandel, Southland and Bay of Plenty.
Bay of Plenty became only the fourth region in the country to break the $500,000 ceiling on realestate.co.nz.
It reached a new high of $501,961, which was up 3% from its previous high of $487,052 set in November.
But there were 7.6% less new listings in the region in January than there were at the same time last year.
Realestate.co.nz chief executive Brendon Skipper said the record highs in January’s average asking price came off the back of a record low in inventory and a decline in new listings.
“National inventory in January hit a new all-time low of 14.7 weeks.
“In addition, the total number of new listings across the country in January was 8,144, down 14.6% compared to the same month a year ago.
“The record highs in average asking price in a number of regions need to be seen in the context of fewer listings and tightening inventory.”
The national average asking price in January was $542,514.
This was up 3.7% from December and ended a four month consecutive decline – but it is still short of the all-time high of $568,215 set in August 2015.
Meanwhile, there was further confirmation of the Auckland market’s slowdown in the realestate.co.nz data.
The SuperCity’s average asking price fell 2.3% to $828,629 in January, which was down on $848,195 in December.
However, Auckland also experienced a decline in listings of 18.4% from the same time last year.
| « Regions setting market pace | Big drop in Auckland prices » |
Special Offers
Comments from our readers
No comments yet
Sign In to add your comment
|
|
Printable version |
|
Email to a friend |
