

No sign of house prices dipping yet
House prices are still streaming upwards, increasing by 3.1% across the country last month.
Wednesday, May 5th 2021, 3:43PM

The annual growth rate hit 18.4% from 16.2% in March, according to the CoreLogic House Price Index (HPI).
CoreLogic research head, Nick Goodall, says it might be a surprise to see property values accelerate last month after the Government introduced the phased removal of interest deductibility for property investors.
However it may take another month or so for these changes to flow through because the monthly index reading includes sales recorded over the past three months.
“We expect a downside impact on housing market growth to become evident over the coming months.”
He says anecdotes throughout April show quieter open homes, a greater share of auctions passing in and the fear of over paying replacing the fear of missing out.
In light of this, Goodall says other measures of market activity have become important, especially monitoring mortgage related valuation activity.
Reduction in demand
The flow of valuations last month shows housing market activity has reduced.
Recent valuation orders are down -11% compared to the previous six months. This could reflect reimplementation of the loan-to-value ratio (LVR) restrictions requiring 30% deposits for buyers from March 1.
It may also reflect the uncertainty caused by the interest deductibility changes, as property investors take the time to assess the broader market impact and their own financial situation.
“The drop is probably lower than many have speculated. It seems there remains enough equity-rich investors and/or other home buyers who previously missed out to make up for the pull-back from other buyers.
“These previously back-row buyers must have enough confidence in the future to remain active.”
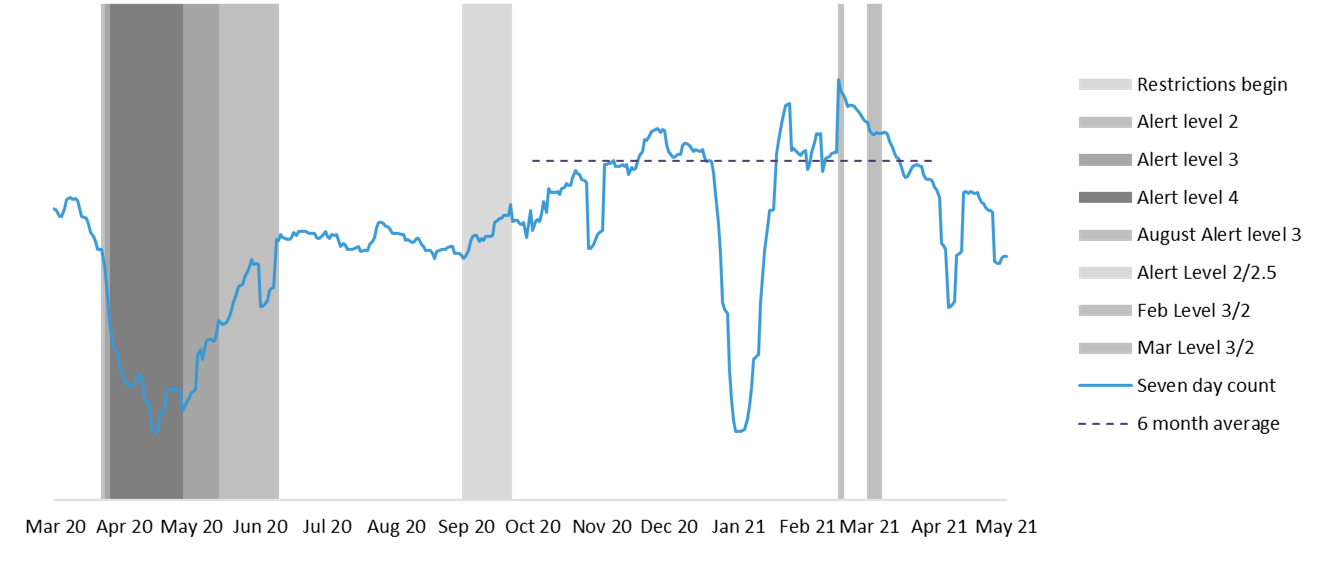
Valuations ordered by banks
No lift in owners exiting the market
There hasn’t been any evidence of home owners selling up.
Trade Me’s listings remained steady throughout April, at about 3,000 new listings a week, until ANZAC weekend hit, when there about 1,800.
The total number of properties listed for sale on Trade Me dropped to 22,300 by the end of April, from 23,100 at the beginning of the month.
Such tight advertised supply levels are likely to keep some sense of urgency in the market as buyers compete for a relatively small pool of advertised properties, says Goodall.
CoreLogic’s pre-listing measure, which tracks the volume of appraisals generated through real estate agent research tools is tracking only -6% behind the levels experienced over the past six months, when the market ran red hot.
The drop in appraisals will partly reflect more sellers listing property through spring and summer and not in autumn, so otherwise illustrates the relative normality of listing activity right now.
Exceptional value growth
What the HPI illustrates is the significant market growth since the country exited level three lockdown almost a year ago, says Goodall.
“The significant value growth was mostly in areas with typically lower values – boosted by interest rates dropping, credit becoming more accessible and the continued attractiveness of property as an investment class.
“This attractiveness was enhanced throughout the pandemic recovery, as the Government stressed its desire to protect asset values over the long term.
“Gisborne and Whanganui, with average values of $579,000 and $485,000 respectively are typical examples of this.”
Both regions have had more than 30% growth in the past year, with some suburbs, such as Outer Kaiti in Gisborne experiencing even greater growth, at 41% taking the median dwelling value to $379k.
“Of the top 10 suburbs nationally for annual value growth, five were in Gisborne, and two were in Whanganui.”
Durie Hill values increased by 34.2% to a median of $551k, and Aramoho surged by 32.4% to $420k.
Eltham, in South Taranaki, Flaxmere in Hastings and Pahiatua in the Tararua District round out the top 10, all with 30% annual growth or more.
Meanwhile the Kāpiti Coast District also experienced an exceptional rate of growth, with the average value appreciating to $882k at the end of April, an increase of 32.7%.
Growth in the property market over the past year has been broad based, with the provincial centres having at least 14% annual growth.
Slowdown still expected
Expectations for future gains has been tempered, as the profitability of investment property has dropped due to the tax changes around interest deductibility.
This will likely mean a slowing of the recent growth rate. Which will give the Reserve Bank some time to assess whether they need to announce any intention to limit interest-only loans or put a cap on high debt-to-income lending.
“Plenty of interest will continue to focus on the Government too, as calls for rent controls linger, and clarification on what constitutes a new build and how long it remains a new build – for both interest deductibility and bright-line exemptions,” says Goodall.
“Many existing and future property investors will be interested in the outcome of those final decisions.”
Main Centres
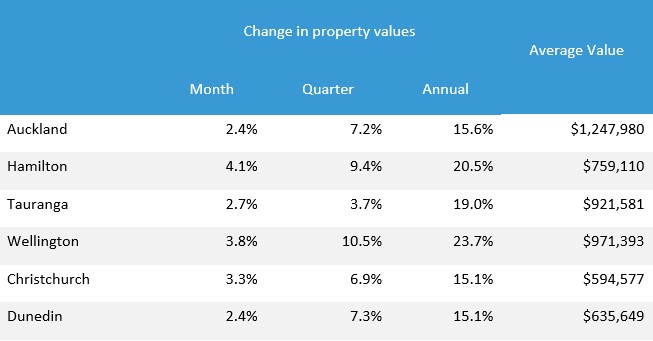
Auckland’s average property values rose by a further 2.4% in April, and the average value is now $1.25 million. The increase over the past 12 months has been 15.6%, or about $168,000.
Strong momentum remains in Hamilton, with quarterly growth climbing to 9.4% and the annual rate of growth at 20.5%. This equals a rise in values over the past year of almost $130,000.
“Mortgaged investors have been very keen on Hamilton, with a 39% share of purchases so far this year – but the latest policy changes will start to impact this group, almost immediately,” says Goodall.
The average property value in Tauranga now exceeds $900,000 for the first time. That is 19.0% higher than a year ago, which equates to a rise of more than $147,000.
Investors, either using a mortgage to secure the purchase or not, continue to pick up the greatest share of sales, at 45% so far in 2021.
Wellington’s property values continue to increase, with the quarterly rate of growth exceeding 10.4% at the end of April.
The annual growth rates show strength throughout the region, from 21.3% in Wellington where the average value equals $1.1 million – to 35% in Masterton, where the average value is $579k.
“Upper Hutt’s rise over the past year has been 29.9%, or more than $188,000.
“As with many other parts of the country, however, there is now clearer evidence that these rampant gains have meant more would-be first home buyers dropping out of the market, either by choice or because prices have exceeded their borrowing capacity” says Goodall.
The quarterly growth in average property values in Christchurch inched higher, to 6.9% at the end of April, pushing up the annual growth rate to 15.1%.
Mortgaged investors have intensified the competition. They have had a 27% share of purchases so far in 2021, a steady rise from about 21% two years ago.
Dunedin’s average property values rose by a further 2.4% in April, although the annual rate of growth did dip slightly to 15.1% from 15.4% at the end of March.
“This equates to a rise over the past year of more than $83,000,” adds Goodall.
The sustained growth rate means prices doubling in just five years, putting pressure on prospective first home buyers, as has been the case around the rest of New Zealand.
Mortgaged investors have been a rising presence – a 31% share of purchases in Dunedin in 2021 is their highest figure on record.
| « Sales to drop keeping values rising | Efforts to dampen housing market not working yet » |
Special Offers
Comments from our readers
No comments yet
Sign In to add your comment
|
|
Printable version |
|
Email to a friend |
