Only 54% of active NZ equities managers beat the benchmark index in 2023
[With VIDEO] A bare majority of actively managed New Zealand equity funds managed to beat the benchmark S&P/NZX 50 Index in calendar 2023 but less than a quarter managed to outperform over 15 years.
Wednesday, February 28th 2024, 1:00PM  2 Comments
by Jenny Ruth

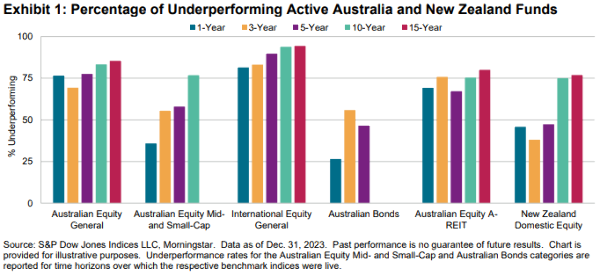
S&P Dow Jones Indices annual SPIVA scorecard, which included New Zealand equity funds for the first time in its analysis of how active managers perform against the relevant indicies, found that 54% of funds outperformed the index in the latest year but only 23% managed to outperform over the last 15 years.
On average, actively managed NZ domestic equity funds achieved a 4.8% return in 2023 on a simple average basis while on a weighted-average basis, with each fund's return weighted by its total net assets, the annual return was 5.1%.
That compares with the S&P/NZX 50 Index's 3.5% return, which is gross and with imputation.
While that might seem somewhat mediocre, more than three quarters of active managers in the Australian equities category failed to keep up with the S&P/ASX 200 Index.
In the international equities category, more than three quarters of active managers also failed to keep pace with the relevant index.
By contrast, only 26% of Australian bond funds lagged the relevant index in the latest year and 80% of funds outperformed over 15 years.
“2023 was among the best of times and the worst of times for actively managed funds,” said the compilers of the 2023 report, head of Asia index investment strategy Sue Lee, Tim Edwards, managing director of index investment strategy and Davide di Giola, head of SPIVA index investment strategy.
The authors noted that central bank policy at home and abroad dictated much of market sentiment.

“The Reserve Bank of Australia (RBA) increased its target rate five times during the year which fluctuating long-term inflation and economic expectations sent longer-dated government bond yields lower, then higher, before they ended the year close to where they began,” they said.
But while the RBA's cash rate reached 4.35% in November last year, the Reserve Bank of New Zealand's reached 5.5% and had been steady at that level since May last year.
The annual comparison for the latest year included 24 domestic equity funds while the three-year comparison included 21 funds and the five-year included 19 funds. The 15 year comparison included only 13 funds.
The SPIVA data shows that 62% of actively managed funds outperformed the index over three years in absolute terms, slightly more than half outperformed over five years but only 25% outperformed over 10 years.
The average NZ fund performance over three years was negative 2.28% but was positive 7.35% over five years, 10.53% over 10 years and 11.51% over 15 years.
None of the NZ funds were liquidated over the past year, over three or five years.
The SPIVA comparisons used Morningstar data for all managed funds domiciled in Austrlai and NZ for which month-end data is available.
S&P Dow Jones Indices is a joint venture between S&P Global, the CME Group and News Corp and is world's leading resource for benchmarks and investable indices.
| « Perpetual Guardian finally gets part of Trustees | Analysing AI’s Impact on Financial Advice, Part 1 » |
Special Offers
Comments from our readers
https://www.spglobal.com/spdji/en/documents/spiva/spiva-australia-year-end-2023.pdf
Sign In to add your comment
| Printable version | Email to a friend |


