

Infrastructure - Having you cake and eating it too
When constructing portfolios, we typically think of allocations to shares, bonds, cash, commodities, and real estate. Infrastructure is increasingly being considered as an investment class in its own right, offering a unique risk and reward profile.
Friday, April 17th 2009, 9:24AM
Infrastructure has a physical presence, just like real estate. It has bond-like cashflows and can provide regular income while being less sensitive to economic cycles than shares and real estate. And it offers capital growth potential, with historical growth rates sitting somewhere between those for shares and property. With infrastructure, you really can have your cake (income) and eat it too (capital growth).
THE TIME IS RIGHT
This is the perfect environment for infrastructure investment. The consistent cash flows associated with infrastructure assets allow regular income to be paid, even as interest rates are falling around the world.
The cashflows generated by infrastructure assets are stable and long-term, and we know that predictability and consistency are more important to investors now than they ever have been. The capital growth profile of infrastructure assets has always been attractive, but prospects are even stronger now that global markets have fallen leaving some superb assets very undervalued.
On top of all that, the likelihood that governments will increase infrastructure spending to boost employment means that infrastructure is receiving increasing attention.
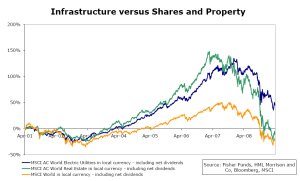
The time is right for infrastructure for another reason too. The MSCI Electric World Electric Utilities Index (a good proxy for infrastructure) outperformed both the MSCI World and MSCI World real estate companies indices during the bull market from 2002 to 2007. And it has proven more recession resistant since the end of 2007, with the result that long run “buy and hold” investors in infrastructure are well ahead, whereas property and share market investors are still nursing negative returns.
DIFFERENT THINGS TO DIFFERENT PEOPLE
The word “infrastructure” is not easy to define. Some think of infrastructure as anything that is regulated or has government backed cash flows, and hence low risk. Others think of infrastructure as anything offering fairly secure cash flows from long life assets. We think of infrastructure as any asset that provides essential services allowing economies to function.
Infrastructure can include the movement of goods (think ports, railways, storage facilities such as tank farms, and postal/courier networks), people (airports, mass transit), energy (transmission/distribution), or voice or data information (telecoms).
While infrastructure investing has been around for a long period of time, historically most infrastructure was developed and owned by governments as they worked to develop their economies.
From around 1960, governments began privatising existing assets and allowed the private sector to become involved through PPPs (public private partnerships). Some of these assets have become listed infrastructure assets, giving small investors an opportunity to invest in the infrastructure sector. However, they are often not well researched and it can be difficult for individual investors to understand the sector.
Infrastructure funds have been around since the early nineties. Infratil (managed by Morrison & Co) was a forerunner of these, later joined by the likes of Macquarie and Babcock & Brown, and more recently Goldman Sachs and Carlyle Group.
NOT ALL INFRASTRUCTURE FUNDS ARE CREATED EQUAL
It would be wrong to look at the dismal performance of some high profile infrastructure funds and assume that infrastructure is an unattractive asset class. Some infrastructure fund managers were seduced by low cost debt on offer during the 2000-2007 period, and chose to highly gear the funds with bank debt, leaving them exposed to refinancing risk now.
Others, such as Infratil, chose to more prudently gear, leaving the infrastructure assets to generate returns without the turbo-charge effect of debt. In spite of the extensive market downturn in recent times, Infratil has managed total returns from infrastructure investing of nearly 15%pa since 1994.
An inevitable result of being over-geared in this current cycle of deleveraging is that funds are looking to sell ‘distressed’ assets. Infrastructure funds that are new to market (such as the Fisher Morrison Infrastructure Fund), that were not fully invested or were prudently invested during the pre credit crunch era (such as Infratil) are now positioned well to take advantage of such sales. Australia in particular appears to have a relatively large number of infrastructure assets and funds that were over geared, with a number of the underlying assets now “on the block”.
INFRASTRUCTURE IS THE BACKBONE OF ECONOMIES AND OF PORTFOLIOS
We know that infrastructure assets are attractive because they offer some of the positive characteristics of other asset classes, such as a consistent income stream as well as strong capital growth potential, without the negative characteristics such as high volatility and unpredictability.
Right now, when previous asset allocation assumptions have been turned on their heads, infrastructure is an obvious choice and is an asset that investors can easily understand.
Investors around the world are regularly being told by their governments of the huge need for infrastructure investment. Developed countries need to upgrade and developing countries have to build from scratch. China is the new leader, with huge developments in energy, roading, rail and ports.
While governments know they need to spend trillions of dollars to make up for years of underinvestment, they have lots of things to spend their money on to kick-start economic growth. This implies that PPPs will become more prevalent as governments look to the private sector to participate in infrastructure projects.
The first investors to get an opportunity to participate in future infrastructure investment will be the sovereign wealth funds (such as the NZ Superannuation Fund, for whom an infrastructure fund is managed by Morrison & Co) and established infrastructure fund managers who are ready to invest (i.e. those without troublesome assets that need to be sold to release funds).
Morrison & Co has joined with Fisher Funds to offer the Fisher Morrison Infrastructure Fund, a fund designed to invest in the best infrastructure opportunities, wherever they are in the world.
The asset class makes sense, the manager knows how to generate returns (few fund managers can boast long-term returns of 15%pa) and the fund is structured to give investors what they are looking for right now – a competitive income yield together with strong capital growth potential. In the case of infrastructure investment, you really can have your cake and eat it too!
by Carmel Fisher, Fisher Funds and Graeme Thomson, Morrison and Co Ltd


| « TOWER: International Fixed Interest: A 2009 Recovery Story? | Tower: Commodity Investing in 2009 » |
Special Offers
Commenting is closed
|
|
Printable version |
|
Email to a friend |
