tmmonline.nz  |   landlords.co.nz        About Good Returns  |  Advertise  |  Contact Us  |  Terms & Conditions  |  RSS Feeds

NZ's Financial Adviser News Centre

GR Logo
Last Article Uploaded: Saturday, September 14th, 8:06PM

News

rss
Latest Headlines

NZ market more secure than Australia’s

Stability reigns in New Zealand’s property market which leaves it in a much better place than Australia’s, new data from Realestate.co.nz shows.

Friday, March 1st 2019, 9:13AM

by The Landlord
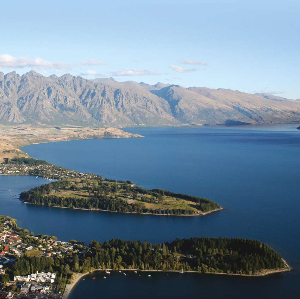
Australia’s biggest markets – Sydney and Melbourne – have seen sharp price falls in recent months but the situation is different in New Zealand

According to Realestate.co.nz’s latest data, there was 26,850 properties for sale in February, which was down by just 0.3% on February 2018.

But it is significantly down on five years ago (February 2014) when there were 41,731 properties listed for sale nationally.

Further, the data shows that February saw a 6.5% fall in new listings as compared to February 2018.

This decline highlights the ongoing supply shortage that many parts of New Zealand are continuing to struggle with.

Around the country, most regions – including Auckland - recorded falls in new listings in February.

Of the five main regions, only the Wellington region recorded an increase in new listings in February: it was up by 6.9% as compared to February 2019.

Realestate.co.nz spokesperson Vanessa Taylor says this situation contrasts with that in Australia where there’s reportedly a long-term high in the number of properties sitting on the market.

New Zealand’s property market is in a good place and there was a sense of relative stability during the month of February, she says.

“We’ve been through the heady days of frantic activity and uncertainty and we have found our new normal.

“It’s characterised by a steady market, stable pricing and a pragmatic approach by buyers and sellers.”

However, the real estate listings website’s data does show that nationwide average asking prices were down by 2.8% to $675,727 in February, as compared to January.

Taylor says that some regions saw prices increases while others saw price falls which evened out the result across the country.

The national price decline also needs to be taken into context of a big January, when there was a record asking price, largely driven by increases in the smaller regions, she says.

“As a result, we are seeing a slight adjustment in February, although four regions still recorded all-time average asking price highs in February.”

Those regions were Gisborne (up 6.7% to $445,938), Waikato (up 3.5% to $609,771), Manawatu / Wanganui (up 1.4% to $387,122) and Central North Island (up 1.2% to $498,380).

Across the country there is an ongoing see-saw for the top spot in average asking price between the Central-Otago Lakes region and the Auckland region.

Taylor says the Central Otago-Lakes area was up 7.5% to $1,010,021 in February, which means it has leapfrogged over the Auckland region’s average asking prices once more.

“This is mainly due to some top end properties hitting the market in the Queenstown district.”

In contrast, Auckland’s average asking price lifted by a mere $233 to $960,715 in February, as compared to $960,482 in January.

Taylor adds that, overall, the market is a more stable environment where buyers and sellers can have more certainty and realistic expectations about what they can achieve.

Tags: average price house prices housing market housing shortage listings price growth property investment

« Scope of CGT likely to narrowConsents at 44 year high »

Special Offers

Comments from our readers

No comments yet

Sign In to add your comment


print

Printable version  

print

Email to a friend
News Bites
Latest Comments
  • It’s time we indexed health insurance
    “@Backstage, I don't think that the IBM analogy is apt. The sale of a computer involves a single transaction between the...”
    2 days ago by KeepThingsSimple
  • It’s time we indexed health insurance
    “I think it could be time to focus forward and not get tangled up on old tolls that were ok at the time. The underlying assumption...”
    3 days ago by Backstage
  • It’s time we indexed health insurance
    “@37 Years too long, In someways, I agree. Part of the challenge is the approach of the old cover vs the new one, and the...”
    4 days ago by JPHale
  • It’s time we indexed health insurance
    “I’d like to see insurers pass back to obsolete products the improvements and limit increases they make when releasing new...”
    5 days ago by 37 years too long
  • It’s time we indexed health insurance
    “This idea is not new. You will not beat the drivers of premium increases with enormous indexation, you will increase defaults...”
    6 days ago by Backstage
Subscribe Now

Mortgage Rates Newsletter

Daily Weekly

Previous News
Most Commented On
Mortgage Rates Table

Full Rates Table | Compare Rates

Lender Flt 1yr 2yr 3yr
AIA - Back My Build 5.94 - - -
AIA - Go Home Loans 8.49 6.45 5.89 5.79
ANZ 8.39 ▼6.95 ▼6.39 ▼6.39
ANZ Blueprint to Build 7.39 - - -
ANZ Good Energy - - - 1.00
ANZ Special - ▼6.35 ▼5.79 ▼5.79
ASB Bank 8.39 6.45 5.89 5.79
ASB Better Homes Top Up - - - 1.00
Avanti Finance 8.90 - - -
Basecorp Finance 9.60 - - -
BNZ - Classic - 6.45 5.89 5.79
Lender Flt 1yr 2yr 3yr
BNZ - Mortgage One 8.44 - - -
BNZ - Rapid Repay 8.44 - - -
BNZ - Std 8.44 6.45 5.89 5.79
BNZ - TotalMoney 8.44 - - -
CFML 321 Loans 6.70 - - -
CFML Home Loans 6.95 - - -
CFML Prime Loans 8.75 - - -
CFML Standard Loans 9.70 - - -
China Construction Bank - 7.09 6.75 6.49
China Construction Bank Special - - - -
Co-operative Bank - First Home Special - 6.19 - -
Lender Flt 1yr 2yr 3yr
Co-operative Bank - Owner Occ 8.15 6.39 ▼5.89 ▼5.79
Co-operative Bank - Standard 8.15 6.89 ▼6.39 ▼6.29
Credit Union Auckland 7.70 - - -
First Credit Union Special - 6.75 6.35 -
First Credit Union Standard 8.50 7.35 6.95 -
Heartland Bank - Online 7.99 6.69 6.35 6.15
Heartland Bank - Reverse Mortgage - - - -
Heretaunga Building Society 8.90 7.00 6.50 -
ICBC 7.85 6.45 5.99 5.89
Kainga Ora 8.39 7.05 6.59 6.49
Kainga Ora - First Home Buyer Special - - - -
Lender Flt 1yr 2yr 3yr
Kiwibank 8.25 7.35 6.89 6.69
Kiwibank - Offset 8.25 - - -
Kiwibank Special - 6.45 5.99 5.89
Liberty 8.59 8.69 8.79 8.94
Nelson Building Society 8.75 6.85 6.39 -
Pepper Money Advantage 10.49 - - -
Pepper Money Easy 8.69 - - -
Pepper Money Essential 8.29 - - -
SBS Bank 8.49 7.19 6.49 6.49
SBS Bank Special - 6.59 5.89 5.89
SBS Construction lending for FHB - - - -
Lender Flt 1yr 2yr 3yr
SBS FirstHome Combo 5.94 5.59 - -
SBS FirstHome Combo - - - -
SBS Unwind reverse equity 9.95 - - -
TSB Bank 9.19 7.25 6.79 6.69
TSB Special 8.39 6.45 5.99 5.89
Unity 8.64 6.70 6.49 -
Unity First Home Buyer special - 6.20 - -
Wairarapa Building Society 8.50 6.65 5.99 -
Westpac 8.39 7.45 6.79 6.59
Westpac Choices Everyday 8.49 - - -
Westpac Offset 8.39 - - -
Lender Flt 1yr 2yr 3yr
Westpac Special - 6.85 6.19 5.99
Median 8.44 6.70 6.35 5.89

Last updated: 12 September 2024 9:27am

About Us  |  Advertise  |  Contact Us  |  Terms & Conditions  |  Privacy Policy  |  RSS Feeds  |  Letters  |  Archive  |  Toolbox  |  Disclaimer
 
Site by Web Developer and eyelovedesign.com