

Prices not impacted by new listings surge
There was an influx of new listings on to the housing market in July but it is making little impact on the shortage of housing stock around New Zealand.
Monday, August 3rd 2020, 11:46AM
by The Landlord

Realestate.co.nz’s latest data reveals that there were 8,808 new listings nationwide in July, which a 20.7% increase on the same time last year.
Broken down by region, the biggest increases in new listings were in the West Coast (81.0), Coromandel (52.4%), and Auckland (39.7%).
The only regions to see new listings decrease last month were Gisborne (26.5%), Wairarapa (30.7%), and Marlborough (3.4%).
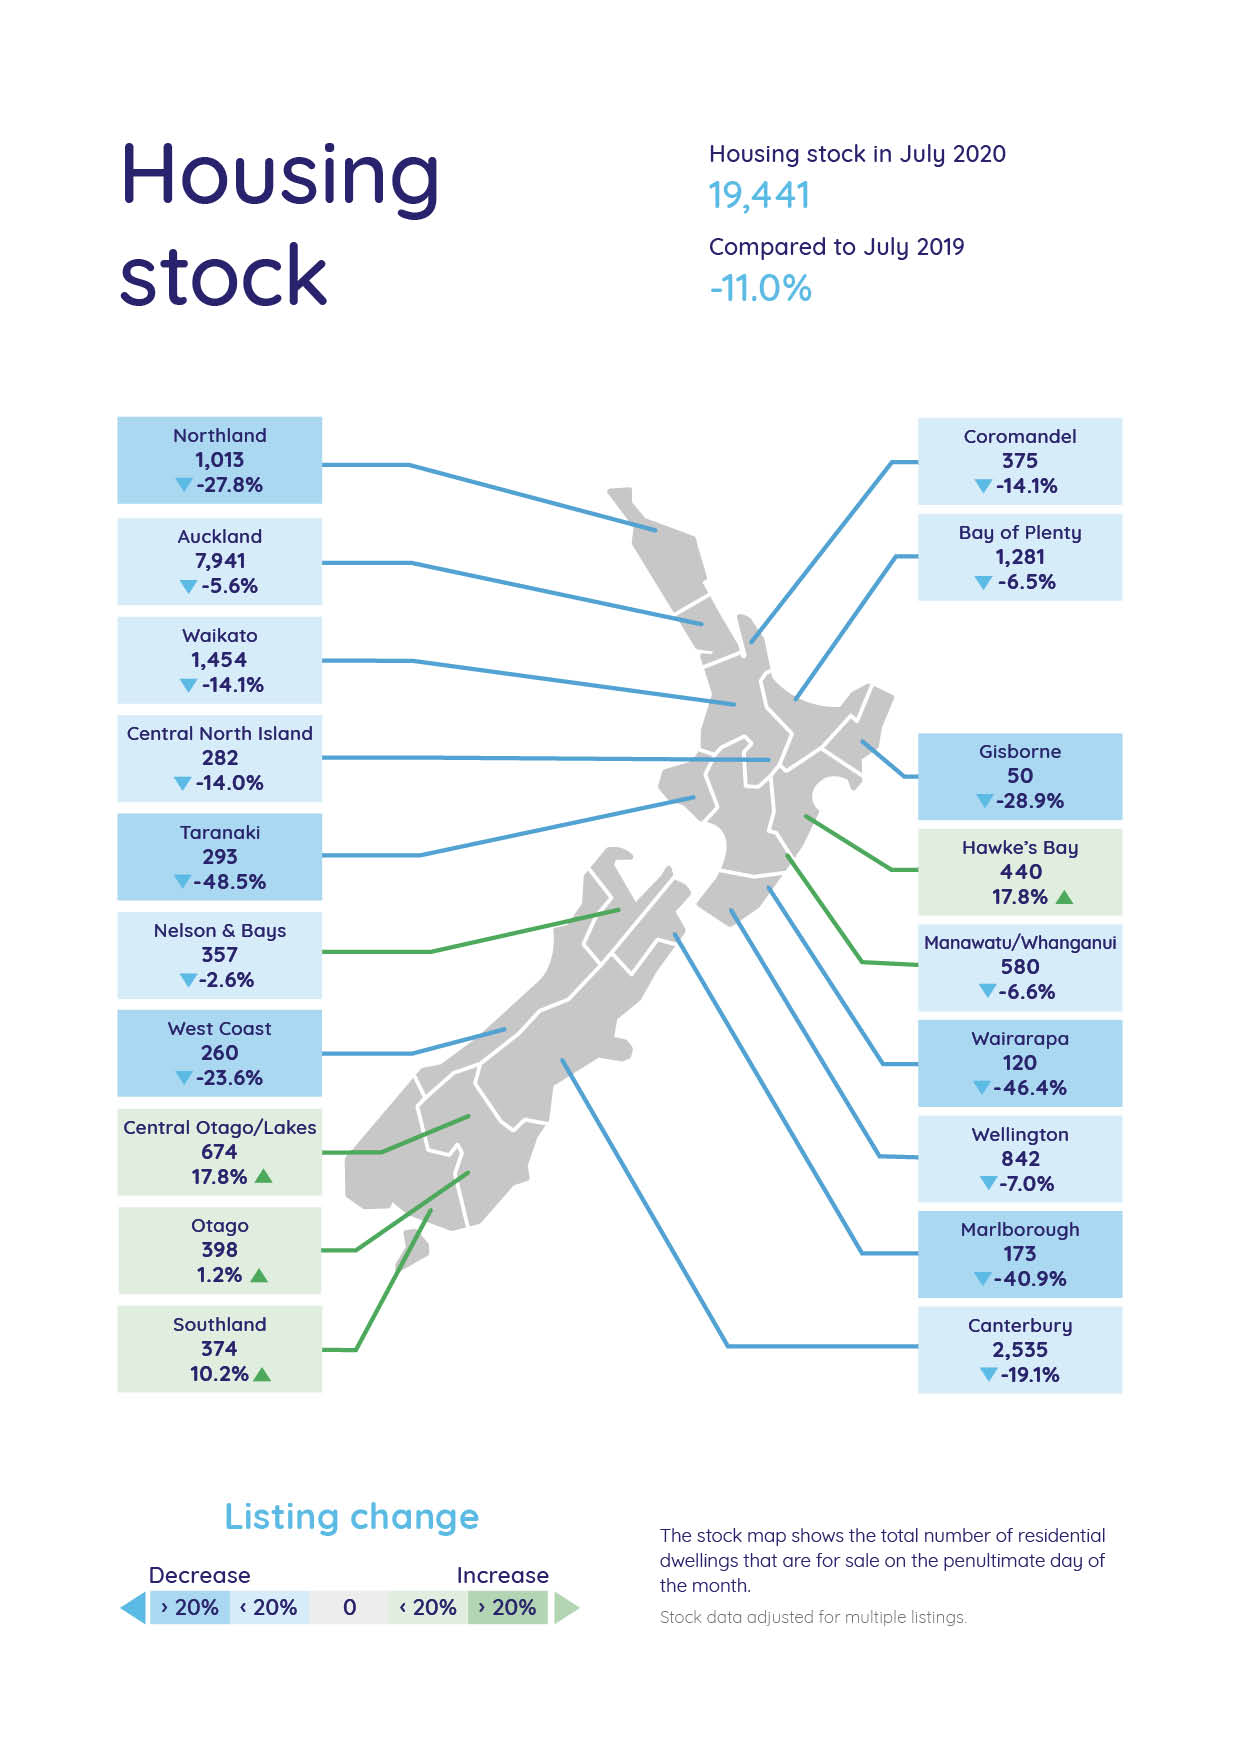
Despite this, stock remains low around the country, with the total number of homes available for sale nationally in July down by 11.0% on the same month in 2019.
Check out Realestate.co.nz's total housing stock map here.
Northland, Gisborne, Taranaki, West Coast, Canterbury, Coromandel, Marlborough, Wairarapa, Central North Island, and Manawatu/Whanganui all saw 13-year record stock lows in July.
Realestate.co.nz spokesperson Vanessa Taylor says the increase in new listings is promising, but the flood of Kiwis returning home is likely increasing demand and putting pressure on an already cramped market.
Demand is soaring with the total number of users to Realestate.co.nz increasing by 16.1% in July as compared to July 2019, while the average session duration increased by more than 12.6%.
Taylor says the combination of high demand and low stock signals means that buyers were snapping up new listings at pace during July.
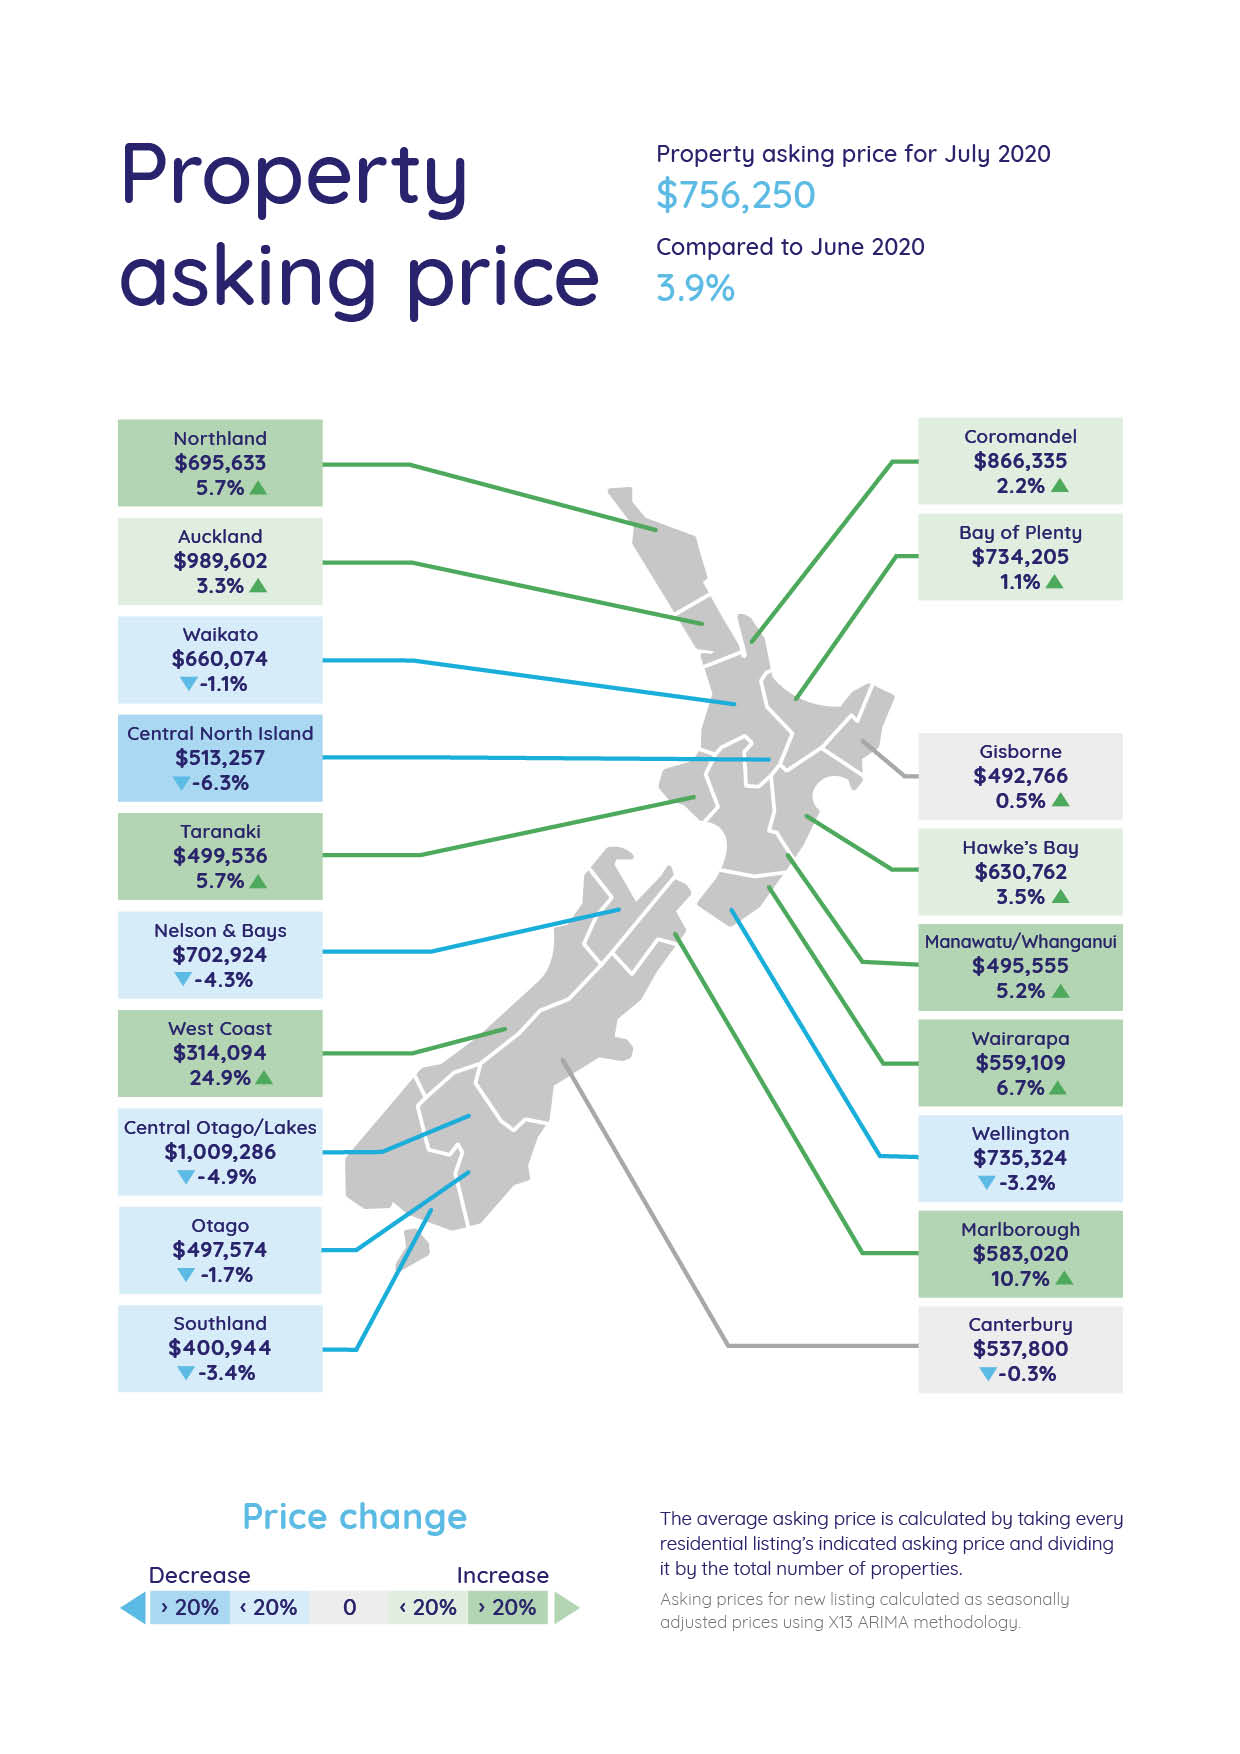
But it is also contributing to rising prices around the country, with the national average asking price up by 3.9% year-on-year to $756,250 in July, she says.
The data also has average asking prices up in nearly all regions with 13-year all-time asking price highs in Northland, Auckland, Hawke’s Bay, Coromandel, and Manawatu/Whanganui.
See Realestate.co.nz's average asking prices map here.
Taylor says that record stock lows in more than half of the regions could be seen as the driver behind the high average asking prices around the country last month.
“The New Zealand property market is a case of demand and supply; when housing stock is low, prices increase because demand is outstripping supply.”
Further evidence of this can be seen in the fact that in most of the regions where total stock increased, average asking prices decreased.
Hawke’s Bay, Central Otago/Lakes, Southland, and Otago all saw the total of properties available for sale go up - by 17.8%, 17.8%, 10.2% and 1.2% respectively.
While asking prices rose by 3.5% in the Hawke’s Bay, in the rest of those regions the stock increases were reflected by a decrease in asking prices.
Average asking prices decreased month-on-month by 4.9% in Central Otago/Lakes, 1.7% in Otago, and 3.4% in Southland.
Overall, this month’s data suggests that despite speculation around prices dropping post-Covid-19, the market seems to be performing well, Taylor says.
“It has been three months since the country moved to alert level three and, while we can never say never, we simply haven’t seen the drop that many were predicting.”
She says that asking price highs won’t be good news for those hoping for a bargain, but that they may give confidence to those thinking of selling.
| « Covid-19 fog hangs over consents increase | Auckland sees highest sales since 2015 » |
Special Offers
Comments from our readers
No comments yet
Sign In to add your comment
|
|
Printable version |
|
Email to a friend |

