

Brakes on value growth
Affordability constraints are applying the brakes to value growth nationwide but QV’s new data proves values are not plummeting at the rate of those across the Tasman.
Wednesday, April 3rd 2019, 6:36AM
by Miriam Bell

Sydney house values have seen a 10.6% annual decline while in Melbourne they have fallen by 9.8%, according to the most recent CoreLogic figures.
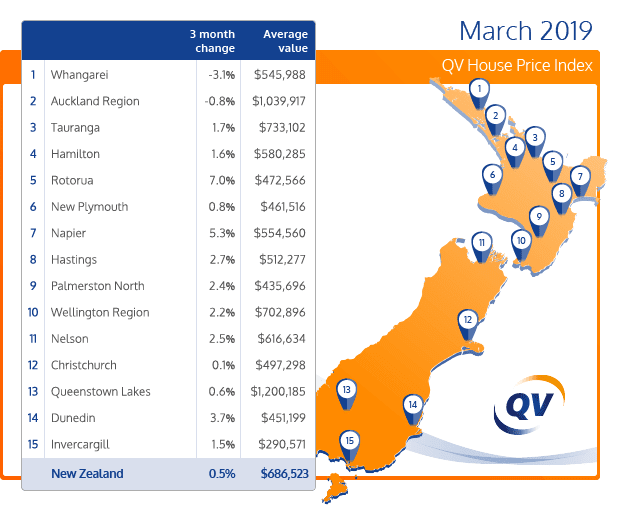
In contrast, the latest QV House Price Index shows New Zealand’s national property values grew by 2.6% over the past year and by 0.5% in the three months to March.
That left the national median value at $686,523 in March 2019.
However, QV general manager David Nagel says their figures show that value growth continues to slow overall, with the national annual growth rate dropping from 7.3% in March last year to 2.6% now.
Affordability constraints are a key factor behind this slowdown, particularly in high value regions like Auckland City which had an average value of $1,230,817 in March, she says.
In the Auckland region overall, value growth decreased by 1.5% year-on-year and by 0.8% over the past quarter, leaving the region’s average value at $1,039,917.
See QV House Price Index table March 2019 here.
Nagel says the strongest value growth is generally being seen in areas such as Rotorua and the Hawkes Bay.
“Rotorua, in particular, experienced a notable increase in average value, up 7.0% with an average value of $472,566. This region appears to be attracting buyers possibly priced out of the nearby Tauranga and Auckland markets.”
Of the main centres, Dunedin continues to lead the value growth pack. It saw value growth of 13.3% year-on-year and by 3.7% in the three months to March.
This left the city’s average value at $451,199, which is still well below the national average of $686,523.
Values across the Wellington Region rose by 8.4% in the year to March and by 2.2% over the past quarter, leaving the region’s average value at $702,896.
Nagel says they are seeing increased demand for different types of housing, such as low maintenance, architecturally designed townhouses in Wellington.
“These properties offer buyers good value for money and we’d expect this trend to continue, particularly in our larger, higher-value cities.”
Going forward, they are anticipating more of the same over the coming months.
He says the Tax Working Group’s recommended capital gains tax shouldn’t impact investor activity much in the short term, but that may change prior to its likely implementation date in April 2021.
“We may see an increase in buyer demand, following the Reserve Bank’s indication that a cut to the OCR is likely. This scenario is anticipated to keep interest rates low, which may increase demand for residential property.”
For CoreLogic head of research Nick Goodall, it’s the Auckland figures that are interesting. Auckland values continue to fall, with the annual growth rate down by 1.5% which is the biggest annual fall since the Global Financial Crisis 10 years ago.
“For full context though it’s worth noting that aside from minor monthly fluctuation, values have effectively plateaued for two and a half years now and across the Super City the average price is still higher than in September 2016.
“This is when the property party in Auckland essentially stopped, with funding considerably tightened, both by way of higher loan-to-value ratio requirements and more stringent bank expense testing.”
While the data shows not much has changed in terms of property value growth, the wider property market environment holds intrigue due to looming tax policy changes and the Reserve Bank’s next OCR decision in May, Goodall says.
“All of this illustrates where our focus remains - on the Government and Reserve Bank - as opposed to the usual macro-economic factors and even international pressures. In the end, the outlook remains one of a gradual easing in property values for the rest of the year.”
| « Investors hold properties for longer | Realism needed in Auckland market » |
Special Offers
Comments from our readers
No comments yet
Sign In to add your comment
|
|
Printable version |
|
Email to a friend |

